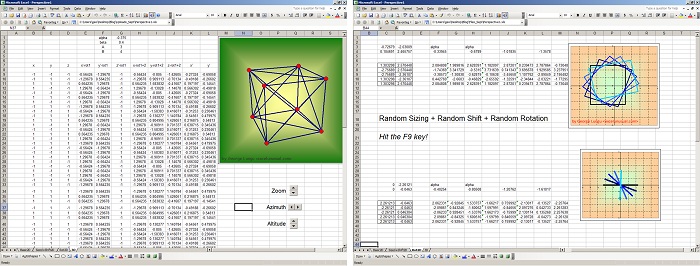
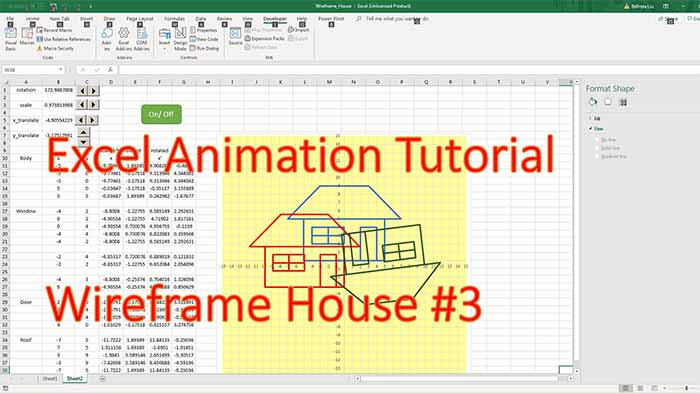
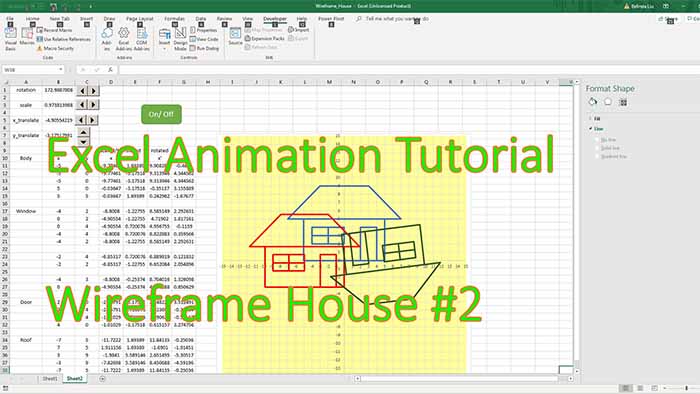
The first two worksheets of this Excel workbook illustrate the creation and display of a rectangle by using a 2D scatter plot. They also show how to adjust its size, translate and rotate it.
In the third worksheet a wire-frame cube is created. 3D-2D perspective calculations are done. The cube can be zoomed and it can also be rotated in azimuth and altitude using simple macros.


Hola George Lungu, muchas felicidades por tu trabajo, es muy creativo y maravilloso.
Gracias Caballero!
Hi Javier,
I am try to plot 3D curves (with x, y z data) in excel using ur method but it seems they doesnt work well.
Does ur method only applicable to my problem?
Thank you,
AH
Albert, the method applies to any problem if you are content to plot wire frame surfaces only (no texture or opacity, just a skeleton surface). What kind of surface are you trying to plot?
I am linking to this blog post and using your demo as a reference. If you would like me to remove the link please message me back and let me know.
Great post by the way!
George,
Do you have an updated version of this that works on Excel2010? I have enabled the macros but none of the buttons work.
Also, do you have a link to the theory that would tell me what alpha, beta, A & B are in the equations?
regards
Andrew
a-ma-zing..
Thanks, Rajed.
hi George!
mi trabajo tiene similitudes al tuyo, en el sentido de los objetos que se encuentran atrás o adelante
Saludos! Vorwärts!
Congratulations for you Blog!
Thanks, Javier.