This is the second part of a tutorial targeted at modeling logic gates in MS Excel 2003.
The first part introduced the basic logic gates,, symbols and associated logic equations. This model includes no delay or loading for the gates.
The following type of gates will are described: inverter, AND, NAND, OR, NOR, XOR (exclusive or) and XNOR.
The tutorial has several parts and the last part builds up to a more complex and accurate model including effects such as: power supply voltage, output impedance and input capacitance (from which low pass fillter effects will be derived within the model). This is not an introduction to digital electronics.
The reader should get somewhat familiar with the topic before attempting to build the models described here.
Introduction to Digital Electronics – Ideal Logic Gates – Part#2
by George Lungu
– This tutorial is the second part of the series introducing the most common logic gates and
their implementation in Excel, first as ideal static models and later using more realistic
animated models which include propagation delay, loading, strength, power supply voltage.
– In the first part we talked about the most common logic gates (INV, AND, NAND, OR, NOR,
XOR, XNOR), their logic equations, their truth tables and we went forward to implementing a
first iteration of a model in Excel 2003.
– This section will finalize the previously started worksheet using purely worksheet formulas for
the gate models. In the last part of this section user defined (custom) function will be created
for each of the seven gates. The functions will be tested in a copy of the first worksheet.
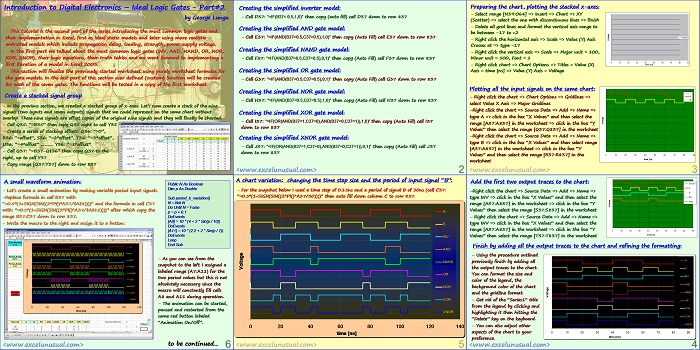
Create a stacked signal group
– In the previous section, we created a stacked group of x-axes. Let’s now create a stack of the nine
signals (two inputs and seven outputs) signals that we could represent on the same chart without
overlap. These nine signals are offset copies of the original nine signals and they will finally be charted.
– Cell Q35: “=B35” then copy Q35 right to cell Y35
– Create a series of stacking offsets: Q36: “=0”,
R36: “=offset”, S36: “=2*offset”, T36: “=3*offset”,
U36: “=4*offset” ……….. Y36: “=8*offset”
– Cell Q37: “=B37-Q$36” then copy Q37 to the
right, up to cell Y37
– Copy range [Q37:Y37] down to row 837
Creating the simplified inverter model:
– Cell D37: “=IF(B37< 0.5,1,0)” then copy (auto fill) cell D37 down to row 837
Creating the simplified AND gate model:
– Cell E37: “=IF(AND(B37>0.5,C37>0.5),1,0)” then copy (Auto Fill) cell E37 down to row 837
Creating the simplified NAND gate model:
– Cell F37: “=IF(AND(B37>0.5,C37>0.5),0,1)” then copy (Auto Fill) cell F37 down to row 837
Creating the simplified OR gate model:
– Cell G37: “=IF(AND(B37<0.5,C37<0.5),0,1)” then copy (Auto Fill) cell G37 down to row 837
Creating the simplified NOR gate model:
– Cell H37: “=IF(AND(B37<0.5,C37<0.5),1,0)” then copy (Auto Fill) cell H37 down to row 837
Creating the simplified XOR gate model:
– Cell I37: “=IF(OR(AND(B37=1,C37=0),AND(B37=0,C37=1)),1,0)” then copy (Auto Fill) cell I37
down to row 837
Creating the simplified XNOR gate model:
– Cell J37: “=IF(OR(AND(B37=1,C37=0),AND(B37=0,C37=1)),0,1)” then copy (Auto Fill) cell J37
down to row 837
Preparing the chart, plotting the stacked x-axes:
– Select range [N39:O64] => Insert => Chart => XY
(Scatter) => select the one with discontinuous lines => finish
– Delete all grid lines and format the vertical axis range to
be between -17 to +2
Series1
– Right click the horizontal axis => Scale => Value (Y) Axis
Crosses at => type -17
– Right click the vertical axis => Scale => Major unit = 100,
Minor unit = 100, Font = 1
0 10 20 30 40 50 60 70 80 90
– Right click chart => Chart Options => Titles = Value (X) time [ns]
Axis = time [ns] => Value (Y) Axis = Voltage
Plotting all the input signals on the same chart:
A
– Right click the chart => Chart Options => Gridlines =>
B
select Value X Axis => Major Gridlines
-Right click the chart => Source Data => Add => Name =>
type A => click in the box “X Values” and then select the
range [A37:A837] in the worksheet => click in the box “Y
Values” then select the range [Q37:Q837] in the worksheet
-Right click the chart => Source Data => Add => Name =>
type B => click in the box “X Values” and then select range
[A37:A837] in the worksheet => click in the box “Y
Values” and then select the range [R37:R837] in the 0 10 20 30 40 50 60 70 80 90
time [ns]
worksheet
Add the first two output traces to the chart: Series1
A
-Right click the chart => Source Data => Add => Name => B
INV
type INV => click in the box “X Values” and then select the
AND
range [A37:A837] in the worksheet => click in the box “Y
Values” then select the range [S37:S837] in the worksheet
– Right click the chart => Source Data => Add => Name =>
type INV => click in the box “X Values” and then select the
range [A37:A837] in the worksheet => click in the box “Y 0 10 20 30 40 50 60 70 80 90
time [ns]
Values” then select the range [T37:T837] in the worksheet
Finish by adding all the output traces to the chart and refining the formatting:
– Using the procedure outlined
A
previously finish by adding all
the output traces to the chart. B
You can format the size and
INV
color of the legend, the
AND
background color of the chart
NAND
and the gridline format.
– Get rid of the “Series1” title OR
from the legend by clicking and
NOR
highlighting it then hitting the
XOR
“Delete” key on the keyboard.
XNOR
– You can also adjust other
aspects of the chart to your 0 10 20 30 40 50 60 70 80 90
time [ns]
preference.
A chart variation: changing the time step size and the period of input signal “B”:
– For the snapshot below I used a time step of 0.15ns and a period of signal B of 30ns (cell C37:
“=0.5*(1+SIGN(SIN((2*PI()*A37/30))))” then auto fill down column C to row 837.
A
B
INV
AND
NAND
OR
NOR
XOR
XNOR
0 20 40 60 80 100 120 140
time [ns]
A small waveform animation:
Public N As Boolean
Dim p As Double
– Let’s create a small animation by making variable period input signals.
-Replace formula in cell B37 with Sub period_b_variation()
N = Not N
“=0.5*(1+SIGN(SIN((2*PI()*A37/$A$8))))” and the formula in cell C37
Do Until N = False
with: “=0.5*(1+SIGN(SIN((2*PI()*A37/$A$11))))” after which copy the
p = p + 0.1
range B37:C37 down to row 837. DoEvents
[A8] = 10 * (4 + 2 * Sin(p / 10))
– Write the macro to the right and assign it to a button:
DoEvents
[A11] = 10 * (2.2 + 2 * Sin(p / 7))
DoEvents
Loop
End Sub
– As you can see from the
snapshot to the left I assigned a
labeled range (A7:A11) for the
two period values but this is not
absolutely necessary since the
macro will constantly fill cells
A8 and A11 during operation.
– The animation can be started,
paused and restarted from the
same red button labeled
“Animation On/Off”.
to be continued…


