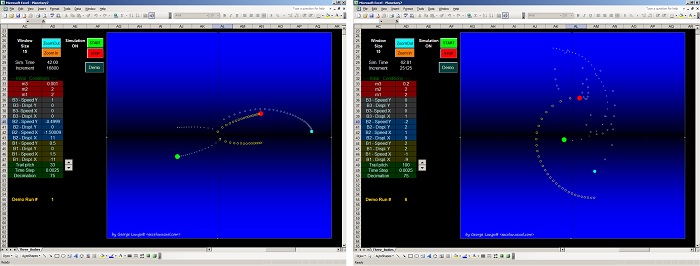
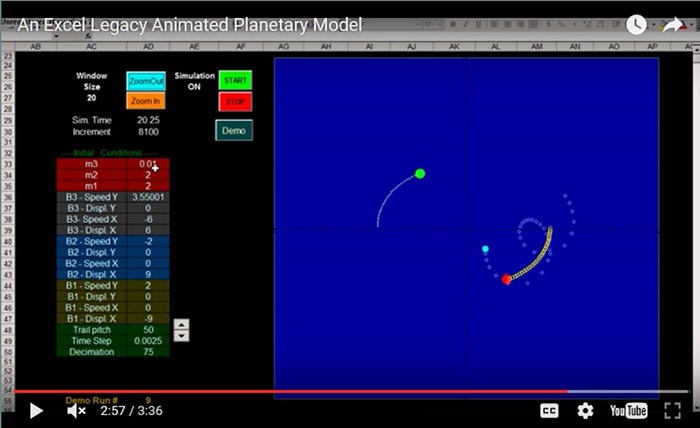
Hi folks, as a continuation to the previous tutorial here is a 3-body planetary model where the solution to the equations is contained in a static form, as a lookup table (I previously called it a “pure spreadsheet solution”).
The model is static in the sense that after any parameter is changed, the solution data remains unchanged in a table until a new parameter is updated by the user. The display is dynamic however since an “Offset()” function will selectively collect data from the table, which data is being displayed on a 2D scatter chart.
A very basic VBA routine is used to generate a counter. The output of the counter is pasted “real-time” in cell “AD30” (called “Increment”). This counter output data is used by the offset function to display a dynamic sequence of the planets’ coordinates on the chart, which gives the illusion of planet movement.
This is a more crude model than the “sequential” models described previously and it has a limited run length (in this particular case 30000 time steps). Click “Demo” to run through a series of setups or “Run” to experiment with your own setup.
This is one of my first Newtonian models, and I did it in the fall of 2008 out of boredom while on a contract in Phoenix. The file is a .zip archive so you need to save it first. Do you have something to say?
I’d love to hear from you so leave me a comment below.
Cheers,
George


Hi,
I liked the basic planetary model! However i wanted the same thing for the 3-body one without the offset, etc. One other thing, do you know how to solve the Szebehely (1967) model of a restricted three body problem taken from Hairer and Wanner (1991 – PAGE 129-130)?
Thx
PS make a tutorial for the basic 3 body as well in pdf!
Vick, I am not familiar wit that article. George
“One considers two bodies of masses 1-mu and mu in a circular rotation in a plane, and a third body of negligible mass moving in the same plane. The equations are:”
y_1” = y_1 + 2*y_2′ – mup*(y_1+mu)/D1 – mu*(y_1-mup)/D2
y_2” = y_2 – 2*y_1′ – mup*y_2/D1 – mu*y_2/D2
D1=[(y_1+mu)^2+y_2^2]^(3/2),
D2 = [(y_1-mup)^2 + y_2^2]^(3/2)
mu = 0.012277471,
mup = 1-mu
Here is an appropriate set of initial values:
y_1(0) = 0.994,
y_1′(0) = 0,
y_2(0) = 0,
y_2′(0) = -2.00158510637908252240537862224
x_{end} = 17.0652165601579625588917206249
Hi, I’d like to create a three dimensional Cartesian coordinate graph of a point in 3D space and the resultant radii, that can be changed by varying the x,y,z variables via slider controls- in Excel 7 or 3 in comp. mode. The change in the variable would be preferably continuous, but, discrete values in small increments would also work . Can anyone, please, teach me how to do that?
Thank You!
Arturo, I am in vacation this week away from my desk. I will try to help you next Monday. George
Hi George. First time reader here — you have some really great stuff on your blog!
Modeling gravitational forces has been an on-again/off-again pet project of mine, but I never came this close to a realistic solution.
Question for you: I am unfortunately stuck with Excel 2007 and its issues. The animation on this file doesn’t really work at all. I know something is happening because if I alt-tab away and back again the display will refresh with whatever the current frame looks like — but animation, no. Any solutions for an E2007 user, even a slow one (solution or user heh heh)?
Love your material… keep it up!
Andy, Insert “DoEvents” in one or 2 places in the loop and it will work fine but relatively slow! Also the most advanced planetary model is:
https://excelunusual.com/3-body-planetary-system-with-options/ It’s faster too! George
Andy, I updated the file, it works in 2007. Very slow though… Cheers, George
I am working on a Surveing Project that we use everyday at WORK
I will share that as soon as I finish it
It will be done with the Exvell Knowledge I learned in this website.
Happy Holidays George
This is a copy of my email
I have a question. And many other in the future, lol
How come my graph does not come out right. Please refer to the attachement 12.27.10
My offset works fine, but the graph does not look like the one without the loop.
When I press the buttom, I should generate a graph like the steady one, but it does not.
By the way, the 3D Part 1 instruction is coming soon. That is the one that built a triangle
in 3D as we input numbers.
Thank you
Francisco
Francisco, Where is the file you are talking about? Are you using 2007?
I sent it via hotmail since I am unable to attach file in this website
I sent it to your email
Outstanding.
I check this website everyday for knowledge. This is a gold mine website