By popular demand I am coming back to Excel after a long hiatus. This is the first in the series of beginner level tutorials targeted to building Excel animated models and games. >. Past a few minutes of introduction into a 4-stroke engine Excel animation model, the video dives into how to build the first and perhaps the most important… Read More... "The Start-Pause VBA Macro for Excel Animation, tutorial – part 1"
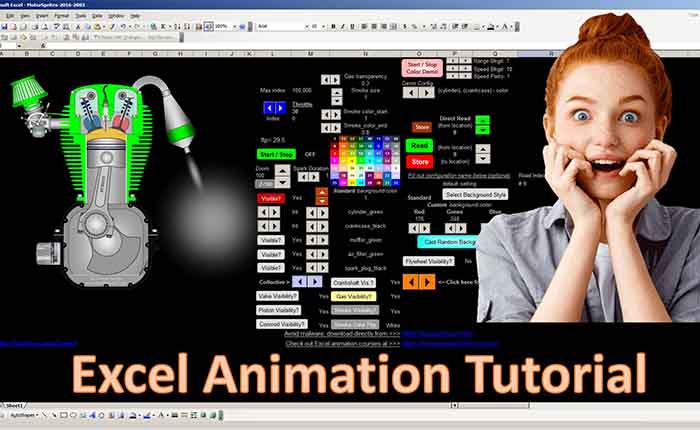
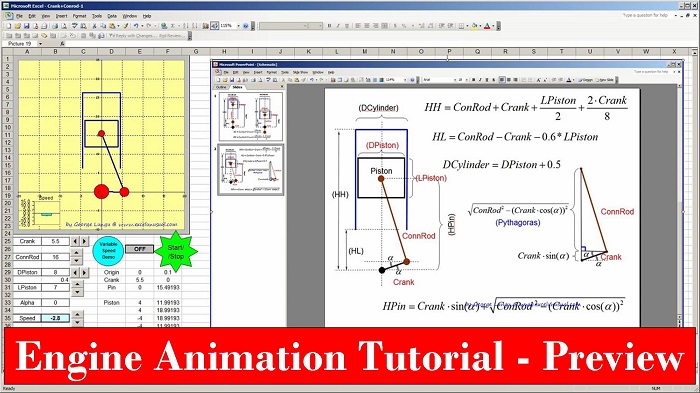
How to Create a Wireframe Internal Combustion Engine 2D Animation in MS Excel – Preview
I am including a preview of our next series of tutorials about creating wireframe animations and games in MS Excel. These wireframe animation methods can be used in various engineering Excel models, as well as in scientific models and games in Excel. This training will be about creating a simple internal combustion engine 2D model in MS Excel. Join out… Read More... "How to Create a Wireframe Internal Combustion Engine 2D Animation in MS Excel – Preview"
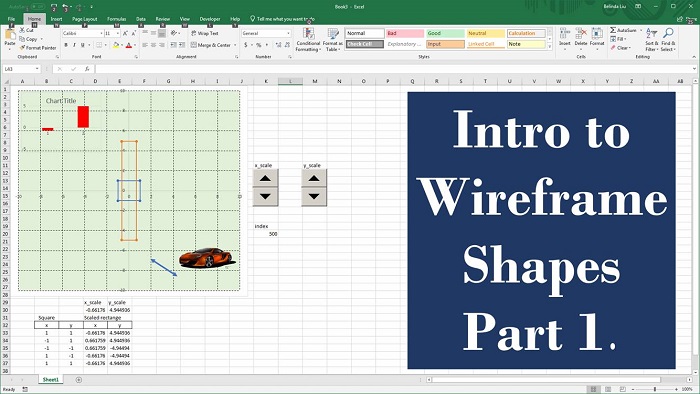
How to Create Wire Frame Shapes for Excel Animation – Video Tutorial – Part 1
This is an introductory video about creating, scaling and animating wireframe shapes in MS Excel. The tutorial is made from the ground up starting with a blank workbook. A square is created. Scaling factors are added which can turn the square into a custom size rectangle. The tutorial demonstrate the use of VBA driven spin buttons and also VBA driven… Read More... "How to Create Wire Frame Shapes for Excel Animation – Video Tutorial – Part 1"
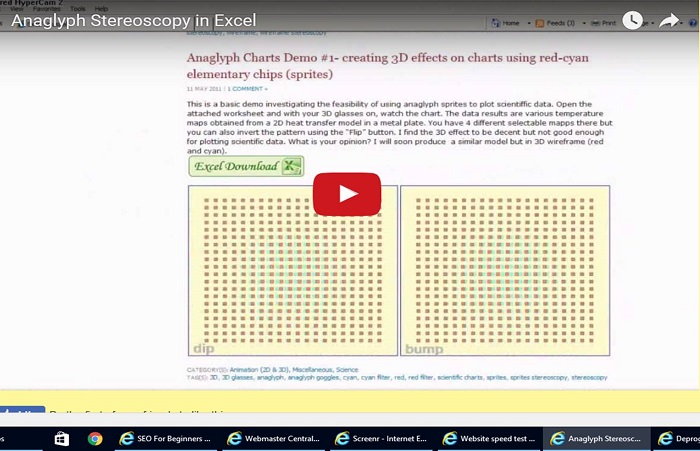
Anaglyph Stereoscopy in Excel – video preview
This is a video preview of a series of posts and models covering anaglyph stereoscopy applied in Excel. The following is a list of links internal to this blog covering the aforementioned topic: – a series of five tutorials in anaglyph stereoscopy leading to the creation of a 3D rotating cube(part#1, part#2, part#3, part#4 and part#5) associated to an Excel… Read More... "Anaglyph Stereoscopy in Excel – video preview"
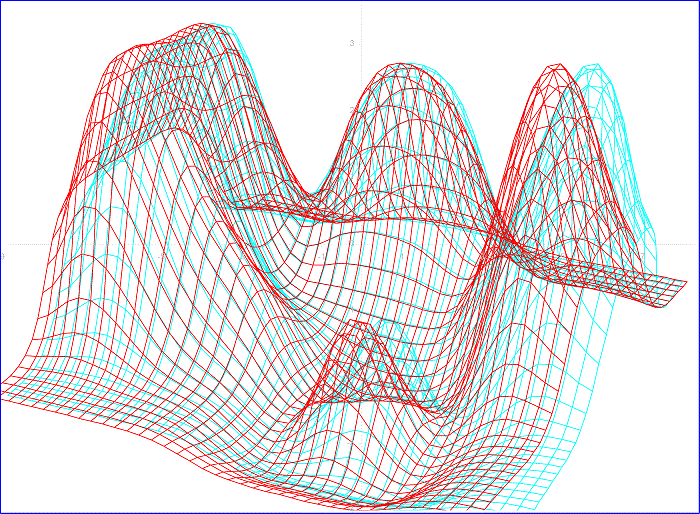
Anaglyph Charts Demo #2- an animated heat transfer model using a red-cyan wireframe chart
This is another basic demo investigating the feasibility of using anaglyph wireframes to plot scientiffic data. Open the attached worksheet and with your 3D glasses on, watch the chart. The data is a dynamic temperature map obtained from a 2D heat transfer model in a metal plate. The heat model is complete and you can run it with various parameters. You can… Read More... "Anaglyph Charts Demo #2- an animated heat transfer model using a red-cyan wireframe chart"