Hi there, this is a tutorial explaining the construction of a very basic Lissajous emulator in Excel.
It’s supposed to be very easy to understand at the high school level.
Good luck,
George
A Lissajous emulator in Excel
by George Lungu
Introduction:
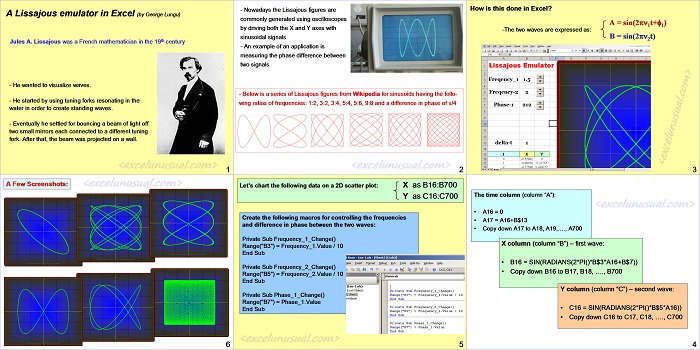
Jules A. Lissajous was a French mathematician from the 19th century
– He wanted to visualize waves.
– He started by using tuning forks resonating in the water in order to create standing waves.
– Eventually he settled for bouncing a beam of light off two small mirrors each connected to a different tuning fork. After that, the beam was projected on a wall.
– Nowadays the Lissajous figures are commonly generated using oscilloscopes by driving both the X and Y axes with sinusoidal signals.
– An example of an application is measuring the phase difference between two signals.
– Below is a series of Lissajous figures from Wikipedia for sinusoidal signals having the follo-wing ratios of frequencies: 1:2, 3:2, 3:4, 5:4, 5:6, 9:8 and a difference in phase of pi/4.
Implementation – How is this done in Excel?
-The two waves are expressed as:
A = sin(2pn1t+f1)
B = sin(2pn2t)
<excelunusual.com> 3
The time column (column “A”):
• A16 = 0
• A17 = A16+B$13
• Copy down A17 to A18, A19,…., A700
X column (column “B”) – first wave:
• B16 = SIN(RADIANS(2*PI()*B$3*A16+B$7))
• Copy down B16 to B17, B18, …., B700
Y column (column “C”) – second wave:
• C16 = SIN(RADIANS(2*PI()*B$5*A16))
• Copy down C16 to C17, C18, …., C700
<excelunusual.com> 4
Let’s chart the following data on a 2D scatter plot:
X as B16:B700
Y as C16:C700
Create three macros for controlling the frequencies and difference in phase between the two waves:
Private Sub Frequency_1_Change()
Range(“B3”) = Frequency_1.Value / 10
End Sub
Private Sub Frequency_2_Change()
Range(“B5”) = Frequency_2.Value / 10
End Sub
Private Sub Phase_1_Change()
Range(“B7”) = Phase_1.Value
End Sub
5
A Few Screenshots:
– 1.5 -1 -0.5 0 0.5 1 1.5
0
– 1.5 -1 -0.5 0 0.5 1 1.5
0
– 1.5 -1 -0.5 0 0.5 1 1.5
by George Lungu <excelunusual.com>


