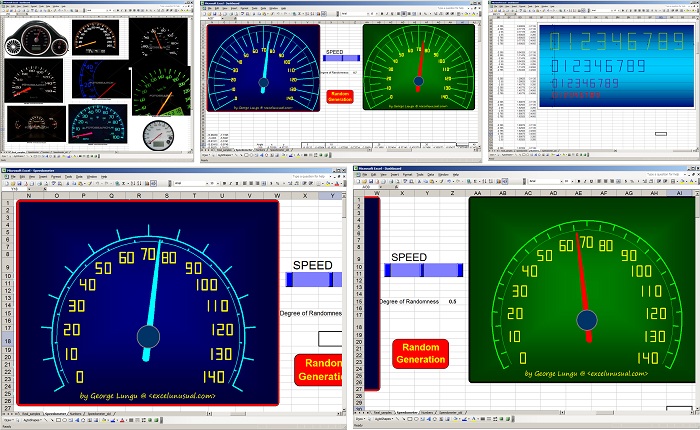
Here is a speedometer in Excel 2003. It’s an old file and the charting wasn’t done in the most economic fashion.
I used too many series while I could have consolidated a lot of the dial curves. It is still a good example of animation and displaying custom numbers on a chart.
There are two VBA macros involved, one for changing the speed value and the other for randomly changing the parameters of the display.
Enjoy,
George


Hi George, this is really very god animated chart.I never seen this kind of chart in my experience.How can we do this speedometer.Please explain me.
hi George,
This is great.
How can I change the range to 0-100 instead of 0-140?
Sailesh
Sailesh, Click in the numbers and see where the series takes the data from then delete the last digits (120, 140 etc). Also make sure you play with the angle between the numbers. Good luck, George
Why the excel book is slow?
Thanks, Sundar!
Amazing,I got an extraordinary thing from here
Hi George,
Unbelievable things! I did not believed that is possible to do something like this in excel …
What do you thing about “bare code image (UPC, EAN, CODE 39, etc)” , without using VBA?
I’m using a Macro (pasted bellow and found on the internet), together with a special font in order to generate bare code imagine in excel and access.
Congratulations,
From Bucharest, Romania 🙂
Bogdan
Public Function ean13$(chaine$)
Dim i%, checksum%, first%, CodeBarre$, tableA As Boolean
ean13$ = “”
If Len(chaine$) = 12 Then
For i% = 1 To 12
If Asc(Mid$(chaine$, i%, 1)) 57 Then
i% = 0
Exit For
End If
Next
If i% = 13 Then
For i% = 2 To 12 Step 2
checksum% = checksum% + Val(Mid$(chaine$, i%, 1))
Next
checksum% = checksum% * 3
For i% = 1 To 11 Step 2
checksum% = checksum% + Val(Mid$(chaine$, i%, 1))
Next
chaine$ = chaine$ & (10 – checksum% Mod 10) Mod 10
CodeBarre$ = Left$(chaine$, 1) & Chr$(65 + Val(Mid$(chaine$, 2, 1)))
first% = Val(Left$(chaine$, 1))
For i% = 3 To 7
tableA = False
Select Case i%
Case 3
Select Case first%
Case 0 To 3
tableA = True
End Select
Case 4
Select Case first%
Case 0, 4, 7, 8
tableA = True
End Select
Case 5
Select Case first%
Case 0, 1, 4, 5, 9
tableA = True
End Select
Case 6
Select Case first%
Case 0, 2, 5, 6, 7
tableA = True
End Select
Case 7
Select Case first%
Case 0, 3, 6, 8, 9
tableA = True
End Select
End Select
If tableA Then
CodeBarre$ = CodeBarre$ & Chr$(65 + Val(Mid$(chaine$, i%, 1)))
Else
CodeBarre$ = CodeBarre$ & Chr$(75 + Val(Mid$(chaine$, i%, 1)))
End If
Next
CodeBarre$ = CodeBarre$ & “*”
For i% = 8 To 13
CodeBarre$ = CodeBarre$ & Chr$(97 + Val(Mid$(chaine$, i%, 1)))
Next
CodeBarre$ = CodeBarre$ & “+”
ean13$ = CodeBarre$
End If
End If
End Function
Salut Bogdane! Multam pentru comentariu. Eu nu am lucrat cu bar-coduri insa cred ca sint la moda. Trebuie sa citesc despre ele.
Si eu tot asa lucrez, iau o farima de pe internet si o dezvolt de 100 de ori insa imi place sa folosesc foarte putin VBA din motive de viteza.
Cum mai e in Bucuresti? Eu am facut electronica acolo. Numai bine, George
Hi, George
How can I make a constant loop?
For example, set speed meter go to a steady and/or different speeds for
unlimited time. Like set the speed go from 20 m/h to 78 m/h and then repeat the same cycle. And the only way to stop would be by pressing the stop bottom
Francisco, Just use one of the loops from the “Dynamic Macros”. Change the “n” if you need to and the maximum value it goes to. The macro will paste it on a cell in the page and you might need to do some “scaling” operation to bring it between your limits (upper/lower speed). George
Hi George
I will try that tonight
I hope you understand my question.
I want my graph to repeat itself until I want to
Stop it.
I am trying to make a Loop that repeats itself
For example, I set the speed meter to go from 20 to
80 m/hr. The loop will make the graph design to
Do that. Once I create a steady repeating loop
The graph will show repeadely itself until I stop it.
I hope you understand question