This is the second part of tutorial walking through the creation of an interactive animated Excel model of a gated ring oscillator in MS Excel 2003.
This section is mainly concerned with the generation of the spin buttons, the macros assigned to them and the insertion of the worksheet functions modeling the NAND gate, the inverters and the delayless multiplexer.
Towards the end of the presentation the first (static) version of the model is finished, the waveforms are plotted and the functionality tested.
![]()

![]()
An Interactive Ring Oscillator Model – Part 2
by George Lungu
– As a quick review, we are building the model of a ring oscillator with an adjustable
number of delay stages (between 2 and 7) and adjustable delay per stage (RC). We achieve
the first part by using a multiplexer in the loop which can select the point within the
inverter chain where the feedback signal is collected.
– In the first part, we presented the models used for the inverter, the NAND gate, the
delay-less multiplexer and we started to implement the Excel worksheet supporting this
model.
– In this part, we will continue the implementation of a static model and in the following
part (third part) we will adapt the static model to work in a dynamic regime, as an infinite
time loop.
The “time_step” macro (continuation):
– Rename worksheet “Tutorial_1”, “Tutorial1&2”
then in the VBA editor modify the existing code,
(named “time_step”) by adding one line, into the
following complete macro:
Private Sub time_step_Change()
[A4] = time_step.Value / 20
End Sub
An analog to digital converter circuit board
<excelunusual.com>
Test the spin button together with its macro:
– If you are still in design mode make sure to click the
“Design Mode” icon in the “Control Toolbox” toolbar and
exit the design mode so you can test the button.
– Now you can click the blue “time_step” button and see Control Toolbox toolbar
the time step changing from 0.05ns to 1ns in increments
of 0.05ns
Design Mode Icon
Create three more spin buttons:
– Following the procedure outlined up to this point in the
presentation create two more spin buttons.
– It might be sometimes easier to just copy the existing
button and change a few parameters using the “Properties”
menu. When you want to copy a button you need to be in
design mode otherwise you will just trigger the macro
instead of selecting the button.
– You can see an outline of the properties of the
Private Sub time_step_Change()
three buttons created so far in the table below
[A4] = time_step.Value / 50
and the VBA code to the right. The third macro End Sub
assigns cell A12 a value from an array of constants.
Private Sub delay_stages_Change()
[A8] = delay_stages.Value
End Sub
Private Sub r_c_Change()
rc_arr = Array(0.1, 0.2, 0.3, 0.5, 0.7, 1, 2, 3, 5, 7, 10)
[A12] = rc_arr(r_c.Value)
<excelunusual.com> End Sub
How do we change the “Enable” value :
– First let’s introduce one more parameter,
“vdd”, in cell A20 and set it to 1.2 V.
Sub enable()
Then name the cell A20 “vdd”
If [A16] = [A20] Then
– Let’s look at the macro to the right:
[A16] = 0
– We named the macro “enable” and you
Else
can notice the word “Private” is missing in
[A16] = [A20]
front of the word “Sub”.
End If
– This macro toggles the value in cell A16
End Sub
between zero and “vdd” (which is
contained in cell A20).
– Bring up the Drawing toolbox: View => Toolbars => Drawing (now you
can see it to the bottom left embedded within the frame of the worksheet)
– Create a shape (a rectangle): In the drawing toolbox select “Text Box” and drag-draw a box around
cell B16 => Type “Enable” inside the box => Double click the box and change the font color to blue, the
colors and lines and the alignment (select “center / center”).
– Close the format menu and right click the shape: Assign Macro => select Sheet1enable => OK
– Now we’ve just assigned a macro to the textbox we created. This is a very important operation and
within this blog we will often assign macros to various shapes, charts, pictures and other types of
objects using the same procedure.
– Please note that if you left the word “Private” in front of the word “Sub” the “Sheet1Enable” macro
wouldn’t have appeared in the Assign Macro menu (you can experiment with that) and also Google the
phrase “private public sub VBA”.
<excelunusual.com>
3
Create the time series:
– Cell A37: “=800*time_step” then copy cell A37 down to cell A837
Create the “enable” series:
– Cell B37: “=enable” then copy cell B37 down to cell B837 (you can use Auto Fill)
Create the “A” series (NAND):
– Cell C37: “=(time_step/r_c)*(IF(AND(B38>vdd/2,J37>vdd/2),0,vdd)-C38)+C38” then copy cell C37
down to cell C837 (you could use Auto Fill)
Create the “B” through “G” series (inverters)
– Cell D37: “=(time_step/r_c)*(IF(C38>vdd/2,0,vdd)-D38)+D38” then copy cell D37 to cell I37
– Copy range D37:I37 down to row 837 (you could use Auto Fill)
Create the delay-less “Out_mux” series:
– Cell J37:
“=IF(AND(delay_stages=2,D37<vdd/2),vdd,0)+IF(AND(delay_stages=3,E37>vdd/2),vdd,0)+IF(AND(delay_stag
es=4,F37<vdd/2),vdd,0)+IF(AND(delay_stages=5,G37>vdd/2),vdd,0)+IF(AND(delay_stages=6,H37<vdd/2),vdd
,0)+IF(AND(delay_stages=7,I37>vdd/2),vdd,0)” then copy cell J37 down to cell J837 (you could use
Auto Fill)
<excelunusual.com>
Charting the waveforms:
– Select range A37:I837 => Insert => Chart =>
XY (Scatter) => select the one with broken
segments and no tick marks => Finish
– Right click the chart => Source Data => Series
=> now delete “Series1” => OK
-Using the proper spin buttons set the number
of stages to 7 and the delay to 1ns so that the
traces are all visible (non overlapping) and
spaced enough so that we can format any of
them without interfering with the rest.
– Click on every trace one by one and increase
their thickness (see the chart snapshot below).
You can also label the chart and change various
colors to your taste.
– We can see that obviously the model works
and it oscillates with a frequency inversely
proportional with RC and the number of stages.
1.4
1.2
1
0.8
0.6
0.4
0.2
0
0 2 4 6 8 10 12 14 16 18
<excelunusual.com>
5
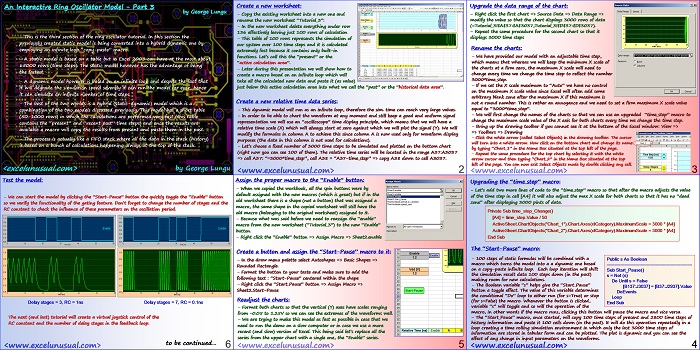
Verification of the model functionality:
– First, set the parameter “Enable” low and confirm
that the circuit doesn’t oscillate (flat waveforms).
Enable = 0
– After that set “Enable” high and you should watch
the oscillation starting on the waveform chart.
– In order to see the oscillation better, copy the chart
and in the new chart delete all the waveforms except
one of them.
1.2 1.2
1 1
0.8 0.8
0.6 0.6
0.4 0.4
0.2 0.2
0 0
0 2 4 6 time [ns] 10 12 14 16 0 2 4 6 time 8[ns] 10 12 14 16
Delay stages = 7, RC = 0.1ns Delay stages = 3, RC = 0.1ns
1.2 1.2
1 1
0.8 0.8
0.6 0.6
0.4 0.4
0.2 0.2
0 0
0 2 4 6 time [ns] 10 12 14 16 0 2 4 6 time 8[ns] 10 12 14 16
Delay stages = 7, RC = 0.2ns Delay stages = 3, RC = 0.2ns
1.2 1.2
1 1
0.8 0.8
0.6 0.6
0.4 0.4
0.2 0.2
0 0
0 2 4 6 time [ns] 10 12 14 16 0 2 4 6 time 8[ns] 10 12 14 16
Delay stages = 7, RC = 0.7ns Delay stages = 3, RC = 0.7ns
<excelunusual.com> to be continued…