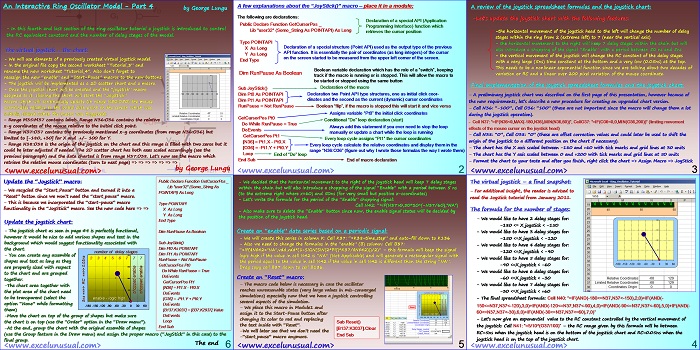
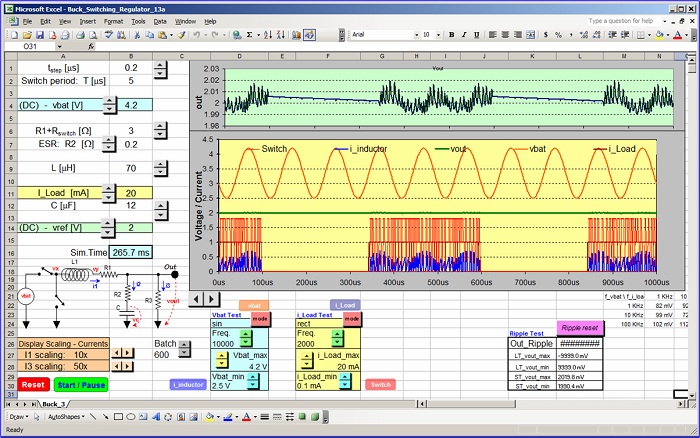
This is the fourth part of tutorial about making an interactive animated Excel model of a gated ring oscillator in MS Excel 2003.
This section adds a joystick to the model which smoothly adjusts the RC delay constant (vertical movement) and the number of delay stages within the ring (horizontal movement).
An additional function of the joystick is to control the gating signal (“Enable”) and place it either logic high or in a periodic mode with a period determined by the position of the same joystick. More detailed joystick theory you can find in this old post.
An Interactive Ring Oscillator Model – Part 4
by George Lungu
– In this fourth and last section of the ring oscillator tutorial a joystick is introduced to control
the RC equivalent constant and the number of delay stages of the model.
The virtual joystick – the chart:
– We will use elements of a previously created virtual joystick model.
– In the original file copy the second worksheet “Tutorial_3” and
rename the new worksheet “Tutorial_4”. Also don’t forget to
reassign the new “enable” and “Start-Pause” macros to the new buttons.
– The joystick will be implemented as a 2D scatter chart and a macro.
– Once the joystick chart will be created and the “joystick” macro
assigned to it, clicking the chart will start the “JoyStick”
macro which will continuously update (in range N50:O50) the mouse
coordinates relative to the initial click point on the screen which was
initially clicked (when the macro was triggered).
– Range M35:M37 contains labels. Range N36:O36 contains the relative
x-y coordinates of the mouse relative to the initial click point.
– Range N37:O37 contains the previously mentioned x-y coordinates (from range N36:O36) but
limited to [-180, +30] for X and +/- 100 for Y.
– Range N38:O38 is the origin of the joystick on the chart and this range is filled with two zeros but it
could be later adjusted if needed. The 2D scatter chart has both axes scaled accordingly (see the
previous paragraph) and the data charted is from range N37:O38. Let’s now see the macro which
retrieve the relative mouse coordinates (turn to next page) => => => => => => =>
by George Lungu
<excelunusual.com>
A few explanations about the “JoyStick()” macro – place it in a module:
The following are declarations:
Declaration of a special API (Application
Public Declare Function GetCursorPos _
Programming Interface) function which
Lib “user32” (Some_String As POINTAPI) As Long
retrieves the cursor positionType POINTAPI
Declaration of a special structure (Point API) used as the output type of the previous
X As Long
API function. It is essentially the pair of coordinates (as long integers) of the cursor
Y As Long
on the screen started to be measured from the upper left corner of the screen.
End Type
Boolean variable declaration which has the role of a “switch”, keeping Dim RunPause As Boolean
track if the macro is running or is stopped.
This will allow the macro to be started or stopped using the same button
Declaration of the macro
Sub JoyStick()
Dim Pt0 As POINTAPI Declaration two Point API type structures, one as initial click coor-
Dim Pt1 As POINTAPI dinates and the second as the current (dynamic) cursor coordinates
RunPause = Not RunPause Boolean “flip”, if the macro is stopped this will start it and vice versa
Assigns variable “Pt0” the initial click coordinates
GetCursorPos Pt0
Conditional “Do” loop declaration (start)
Do While RunPause = True
Always add this statement if you ever need to stop the loop
DoEvents
manually or update a chart while the loop is running
GetCursorPos Pt1
Every loop cycle assigns “Pt1” the cursor coordinates
[N36] = Pt1.X – Pt0.X
Every loop cycle calculate the relative coordinates and display them in the
[O36] = -Pt1.Y + Pt0.Y
range “N36:O36” (figure out why I wrote those formulas the way I wrote them)
Loop End of “Do” loop
End Sub End of macro declaration
<excelunusual.com> 2
A review of the joystick spreadsheet formulas and the joystick chart:
- Let’s update the joystick chart with the following features:
- the horizontal movement of the joystick head to the left will change the number of delay
stages within the ring from 2 (extreme left) to 7 (near the vertical axis) - the horizontal movement to the right will keep 7 delay stages within the chain but will
also introduce a chopping of the signal “Enable” with a period between 50 ns and 5n - the vertical movement of the joystick will change the RC constant of the delay stages
with a very large (5ns) time constant at the bottom and a very low (0.05ns) at the top.
This needs to be a nonlinear exponential function since we are talking about two decades of
variation or RC and a linear over 200 pixel variation of the mouse coordinate.
Final implementation of the joystick spreadsheet formulas and the joystick chart:
A preliminary joystick chart was described on the first page of this presentation, however because of
the new requirements, let’s describe a new procedure for creating an upgraded chart version.
– Cell N36: “-100”, Cell O36: “100” (these are not important since the macro will change them a lot
during the joystick operation).
– Cell N37: “=IF(N36<0,MAX(-180,N36),MIN(N36,60))”, CellO37: “=IF(O36<0,0,MIN(O36,200))” (limiting movement
effects of the mouse cursor on the joystick head)
– Cell N38: “0”, Cell O38: “0” (these are offset correction values and could later be used to shift the
origin of the joystick to a different position on the chart if necessary).
– The chart has the X axis scaled between -180 and +60 with tick marks and grid lines at 30 units
– The chart has the Y axis scaled between 0 and +200 with tick marks and grid lines at 50 units
– Format the chart to your taste and after you finish, right click the chart => Assign Macro => JoyStick
<excelunusual.com> 3
The virtual joystick – a final snapshot:
– For additional insight, the reader is advised to
read the Joystick tutorial from January 2011.
The formula for the number of stages:
– We would like to have 2 delay stages for:
<= X_joystick < -150
– We would like to have 3 delay stages for:
<=X_joystick < -120
We would like to have 4 delay stages for:
<=X_joystick < -90
We would like to have 5 delay stages for:
<=X_joystick < -60
We would like to have 6 delay stages for:
<=X_joystick < -30
We would like to have 7 delay stages for:
<=X_joystick < +60
– The final spreadsheet formula: Cell N40: “=IF(AND(-180<=N37,N37<-150),2,0)+IF(AND(-
150<=N37,N37<-120),3,0)+IF(AND(-120<=N37,N37<-90),4,0)+IF(AND(-90<=N37,N37<-60),5,0)+IF(AND(-
60<=N37,N37<-30),6,0)+IF(AND(-30<=N37,N37<=60),7,0)”
– Let’s now give an exponential value to the RC constant controlled by the vertical movement of
the joystick: Cell N41: “=5/10^(O37/100)” – the RC range given by this formula will be between
RC=5ns when the joystick head is on the bottom of the joystick chart and RC=0.05ns when the
joystick head is on the top of the joystick chart.
<excelunusual.com> 4
– We decided that the horizontal movement to the right of the joystick head will keep 7 delay stages
within the chain but will also introduce a chopping of the signal “Enable” with a period between 5 ns
(to the extreme right where x=60) and 50ns (for very small but positive x-coordinates)
– Let’s write the formula for the period of the “Enable” chopping signal:
Cell N42: “=IF(N37>0,50*10^(-N37/60),”NA”)
– Also make sure to delete the “Enable” button since now, the enable signal status will be decided by
the position of the joystick head.
Create an “enable” data series based on a periodic signal:
– We will create this series in column K: Cell K37: “=K38+time_step” and auto-fill down to K136
– Also we need to change the formulas in the “enable” (B) column: Cell B37:
“=IF($N$42=”NA”,vdd,vdd*(1+SIGN(SIN(2*PI()*K37/$N$42)))/2)” – this formula will keep the signal
logic high if the value in cell N42 is “NA” (Not Applicable) and will generate a rectangular signal with
the period equal to the value in cell N42 if the value in cell N42 is different than the string “NA”.
Drag copy cell B37 down to cell B136.
Create an “Reset” macro:
– The macro code below is necessary in case the oscillator
reaches unreasonable states (very large values in mis-converged
simulations) especially now that we have a joystick controlling
several aspects of the simulation.
– We place this macro in Module1 and
assign it to the Start-Pause button after
changing its color to red and replacing
Sub Reset()
the text inside with “Reset”.
[B137:K3037].Clear
-We will later see that we don’t need the
End Sub
-“start_pause” macro anymore.
<excelunusual.com> 5
Public Declare Function GetCursorPos _
Update the “Joystick” macro:
Lib “user32” (Some_String As
– We recycled the “Start_Pause” button and turned it into a
POINTAPI) As Long
“Reset” button since we won’t need the “start_pause” macro.
– This is because we incorporated the “start-pause” macro Type POINTAPI
functionality in the “JoyStick” macro. See the new code here => => X As Long
Y As Long
End Type
Update the joystick chart:
Dim RunPause As Boolean – The joystick chart as seen in page #4 is perfectly functional,
however it would be nice to add various shapes and text in the
background which would suggest functionality associated with Sub JoyStick()
Dim Pt0 As POINTAPI
the chart.
number of delay stages
Dim Pt1 As POINTAPI
– You can create any assemble of
RunPause = Not RunPause
shapes and text as long as they
GetCursorPos Pt0
are properly sized with respect
Do While RunPause = True
to the chart and are grouped
DoEvents
together.
GetCursorPos Pt1
-The chart area together with
[N36] = Pt1.X – Pt0.X
the plot area of the chart need
DoEvents
to be transparent (select the enable – logic high [O36] = -Pt1.Y + Pt0.Y
option “None” while formatting DoEvents
-180 -150 -120 -90 -60 -30 0 30 60
them) [B137:K3037] = [B37:K2937].Value
-Move the chart on top of the group of shapes but make sure DoEvents
Loop
the chart is on top (use the “Order” option in the “Draw menu”).
End Sub
-At the end, group the chart with the original assemble of shapes
(use the Group feature in the Draw menu) and assign the proper macro (“JoyStick” in this case) to the
final group.
The end
<excelunusual.com>


