I dedicate this section to modeling games in MS Excel. These are not the hidden Excel games such as the Easter Egg for instance. Download the free games available and use them in any version of Excel. Due to the excessive amount of new features, the new Excel versions would be slower though. Lean how to develop animations in MS Excel which you can use as games. You can certainly impress your colleagues. These are animations and games that YOU created! You can impress your bosses too. As a consequence you might snag yourself a bonus or even a promotion. Though seemingly hard, you might find developing certain games in a spreadsheet can be quite easy and satisfying. There nonetheless several different ways of creating such games. The first thing people are concerned when seeing excel games is animation. How can you possibly do that, they ask? Without trying to be exhaustive, there are essentially three methods to create animation in a spreadsheet.
Method #1 – Selective Cell Fill
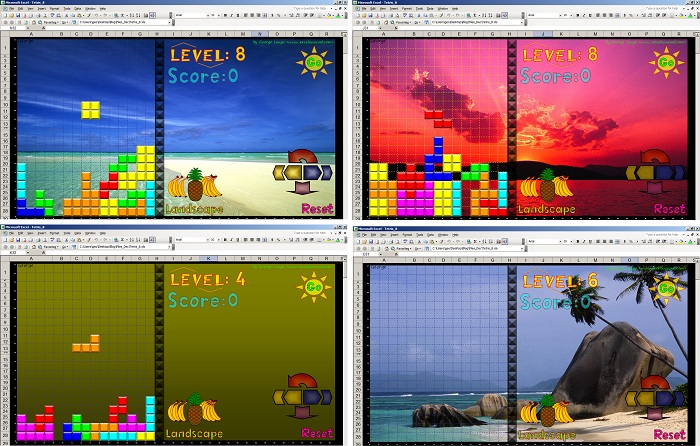
The simplest method would be to selectively fill groups of spreadsheet cells with different colors and use VBA code (Visual Basic for Applications) to change these colors in time. This style of animation is better used in creating excel puzzles.
Method #2 – Shape Manipulation
You can create various shapes in PowerPoint or directly in Excel, using the “draw” menu. After properly renaming these shapes you can again use VBA game code to move them around, or re-scale them, or change the color in real time.
Method #3 – Using Wire Frames
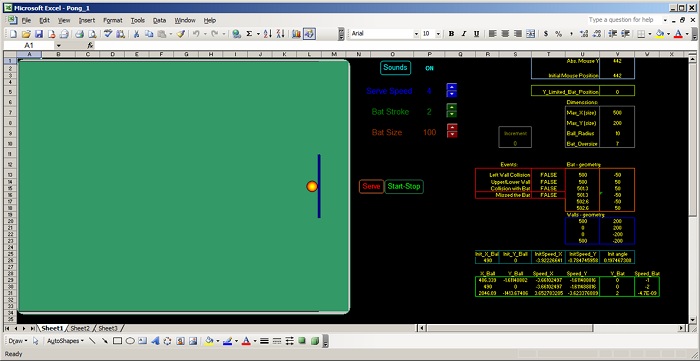
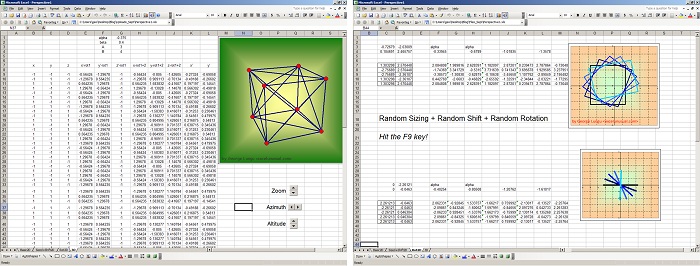
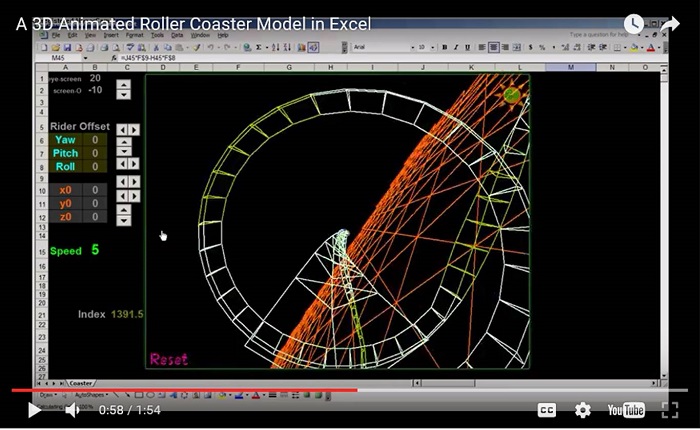
You can also use a scatter chart to display x-y data as simple “wire-frame” objects. Of course you will need to develop basic algorithms or code to manipulate and change the data in time.
Method #4 – Scatter Charting
You can also use a scatter chart to display x-y vertices only and instead of markers you will paste an image on each vertex. This method is very similar to the previous one. The images manipulated on the chart are called “sprites”. Imagine a puppet show, where you can handle many different dolls but only a few are “active”, which means the spectators see them displayed above the curtain.