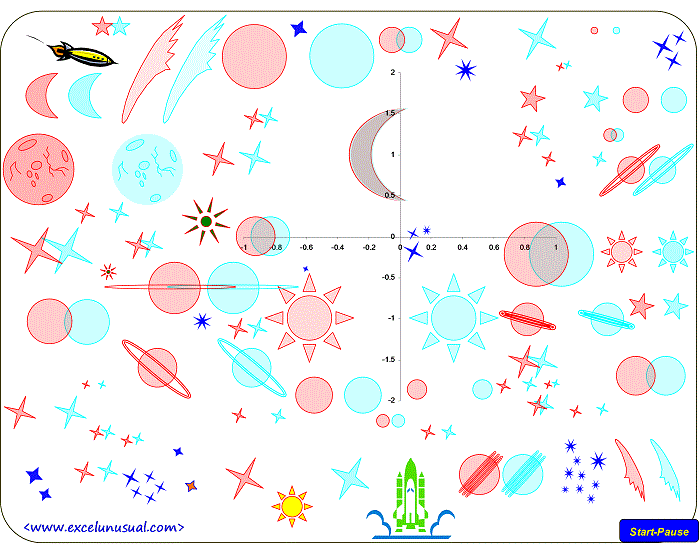
Reach out for your 3D goggles because this is a representation of the Cosmos through the eyes of a 5-year old. The model displays a few objects at various depths and move two of them back and forth on a chart to demonstrate the stereoscopic effect. Though very simplistic it is an excellent example of anaglyph stereoscopy in action showing you… Read More... "Cosmos Naive – a very basic demo of anaglyph stereoscopy with sprites in Excel"
I dedicate this section to modeling games in MS Excel. These are not the hidden Excel games such as the Easter Egg for instance. Download the free games available and use them in any version of Excel. Due to the excessive amount of new features, the new Excel versions would be slower though. Lean how to develop animations in MS Excel which you can use as games. You can certainly impress your colleagues. These are animations and games that YOU created! You can impress your bosses too. As a consequence you might snag yourself a bonus or even a promotion. Though seemingly hard, you might find developing certain games in a spreadsheet can be quite easy and satisfying. There nonetheless several different ways of creating such games. The first thing people are concerned when seeing excel games is animation. How can you possibly do that, they ask? Without trying to be exhaustive, there are essentially three methods to create animation in a spreadsheet.
Method #1 – Selective Cell Fill
The simplest method would be to selectively fill groups of spreadsheet cells with different colors and use VBA code (Visual Basic for Applications) to change these colors in time. This style of animation is better used in creating excel puzzles.
Method #2 – Shape Manipulation
You can create various shapes in PowerPoint or directly in Excel, using the “draw” menu. After properly renaming these shapes you can again use VBA game code to move them around, or re-scale them, or change the color in real time.
Method #3 – Using Wire Frames
You can also use a scatter chart to display x-y data as simple “wire-frame” objects. Of course you will need to develop basic algorithms or code to manipulate and change the data in time.
Method #4 – Scatter Charting
You can also use a scatter chart to display x-y vertices only and instead of markers you will paste an image on each vertex. This method is very similar to the previous one. The images manipulated on the chart are called “sprites”. Imagine a puppet show, where you can handle many different dolls but only a few are “active”, which means the spectators see them displayed above the curtain.
Introduction to Anaglyph Stereoscopy in Excel – part #4: worksheet implementation of a stereoscopic cube
This is the final part of the anaglyph stereoscopy tutorial. This part deals with the prectical implementation of the concepts and formulas discussed before to create a 3D cube. You need 3D glasses to notice the stereoscopic effect. The PDF erroneously claims this is part #3 of the tutorial, whereas this is actually part #4 (it’s a typo in the… Read More... "Introduction to Anaglyph Stereoscopy in Excel – part #4: worksheet implementation of a stereoscopic cube"
Introduction to Anaglyph Stereoscopy in Excel – part #3: a few analogies and the derivation of the stereoscopic 3D-2D perspective conversion formulas
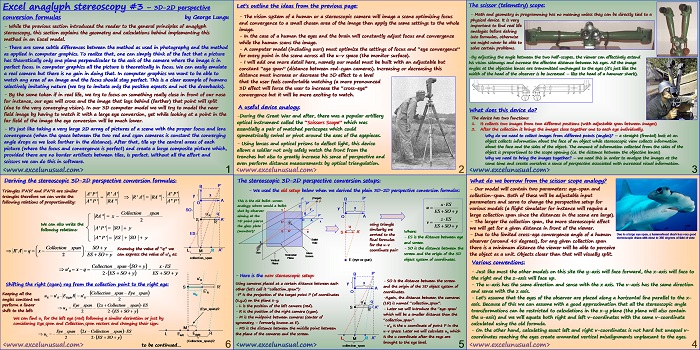
This section of the tutorial gives few more real life applications of the stereoscopic vision and also derives the stereoscopic 3D-2D perspective conversion formulas. These formulas are based on the approximation that the that both right and left eyes observe the same v-coordinate. Excel anaglyph stereoscopy #3 – 3D-2D perspective conversion formulas by George Lungu – While the previous section introduced the… Read More... "Introduction to Anaglyph Stereoscopy in Excel – part #3: a few analogies and the derivation of the stereoscopic 3D-2D perspective conversion formulas"
Introduction to Anaglyph Stereoscopy in Excel – part #2: the principles of creating and viewing 3D pictures
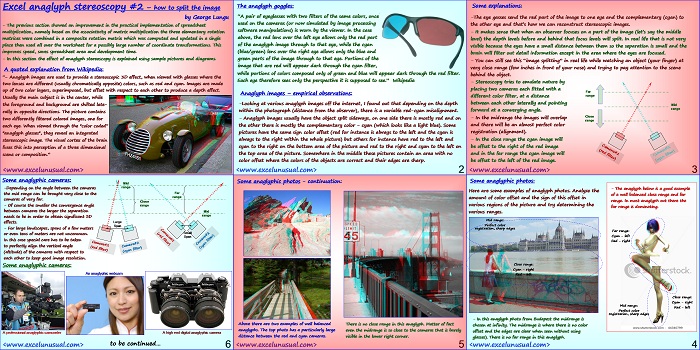
This tutorial explains the basic principles of creating and displaying anaglyph pictures. Excel anaglyph stereoscopy #2 – how to split the image by George Lungu – The previous section showed an improvement in the practical implementation of spreadsheet multiplication, namely based on the associativity of matrix multiplication the three elementary rotation matrices were combined in a composite rotation matrix which… Read More... "Introduction to Anaglyph Stereoscopy in Excel – part #2: the principles of creating and viewing 3D pictures"
Introduction to Anaglyph Stereoscopy in Excel – part #1: a more efficient composite rotation in the 3D Cartesian space
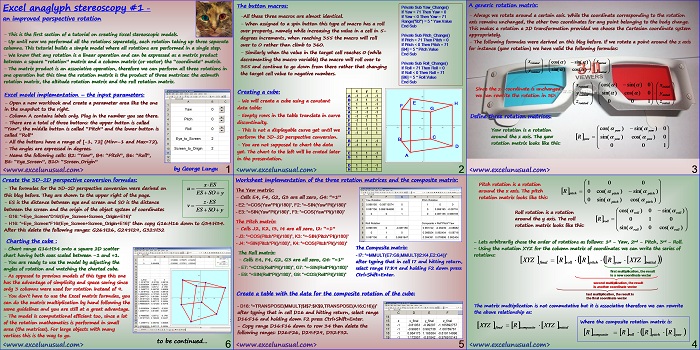
I made a stereoscopic model in October last year, however, choosing the wrong colors (red and blue on a black background, the effect was very weak (if any). This series was suggested to me last week by one of the guests here on the website, Don L. (thanks Don!), who sent me his stereoscopic cube. I opened the model, put on… Read More... "Introduction to Anaglyph Stereoscopy in Excel – part #1: a more efficient composite rotation in the 3D Cartesian space"
Flight Simulator Tutorial #7 – upgrading the joystick chart, adding a reset button and a throttle scroll bar
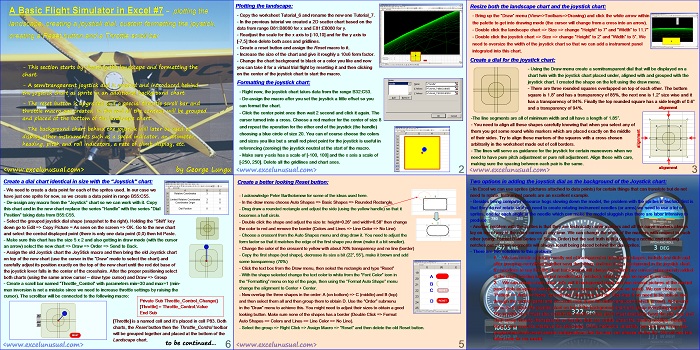
This section displays the landscape on a 2D scatter chart and also upgrades the joystick chart by adding a dial behind the joystick image. This technique of using a stack of a back chart to display dial sprites and a front chart with transparent background to display various control devices, indicator needles and text will extensively be used in this… Read More... "Flight Simulator Tutorial #7 – upgrading the joystick chart, adding a reset button and a throttle scroll bar"
Flight Simulator Tutorial #6 – macro review, scene derivation and integration, mapping of the 2D u-v data into a chartable 1D array, rejecting image artifacts
This section finishes the macro analysis and continues with the conversion of the u-v 2D formula array into a chart-able 1D array. It also adds two columns to the chart-able array, a masking condition for each triangle and masked u-coordinate which will throw out of the visible portion of the chart any shape which has a minimum of one vertex… Read More... "Flight Simulator Tutorial #6 – macro review, scene derivation and integration, mapping of the 2D u-v data into a chartable 1D array, rejecting image artifacts"
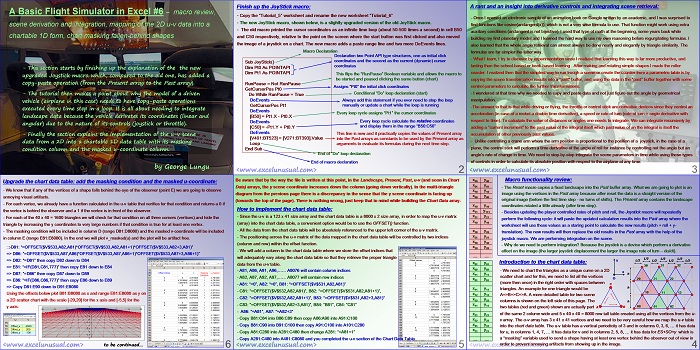
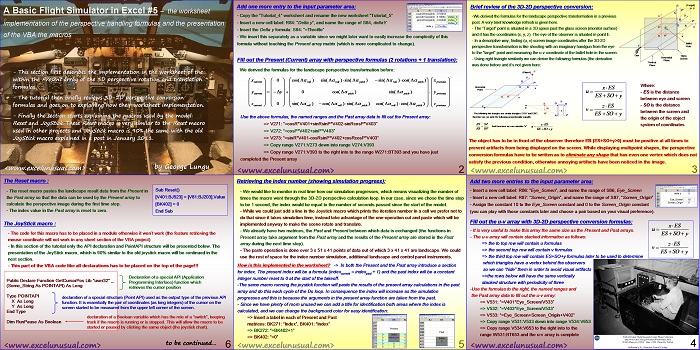
Flight Simulator Tutorial #5 – the worksheet implementation of the perspective handling formulas and VBA the macros
This section explains the spreadsheet implementation of the perspective rotation and translation formulas within the Present array. It also shows the implementation of the 3D-2D conversion formulas within the Past array, then it goes on to presenting the VBA macros used (the Reset and JoyStick macros). [sociallocker][/sociallocker] A Basic Flight Simulator in Excel #5 – the worksheet implementation of the… Read More... "Flight Simulator Tutorial #5 – the worksheet implementation of the perspective handling formulas and VBA the macros"
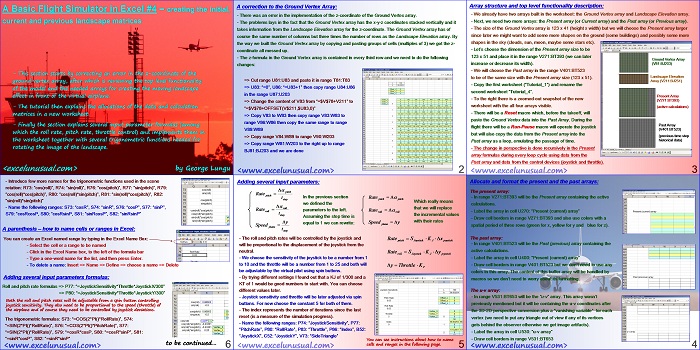
Flight Simulator Tutorial #4 – matrix allocation and input parameter formulas (roll rate, pitch rate, throttle)
This section explains the top level functionality of the model, it also allocates the data and formula arrays needed for manipulating the scene image. The roll rate, pitch rate and throttle formulas are implemented in the worksheet. [sociallocker][/sociallocker] A Basic Flight Simulator in Excel #4 – creating the initial, current and previous landscape matrices by George Lungu – This section starts… Read More... "Flight Simulator Tutorial #4 – matrix allocation and input parameter formulas (roll rate, pitch rate, throttle)"
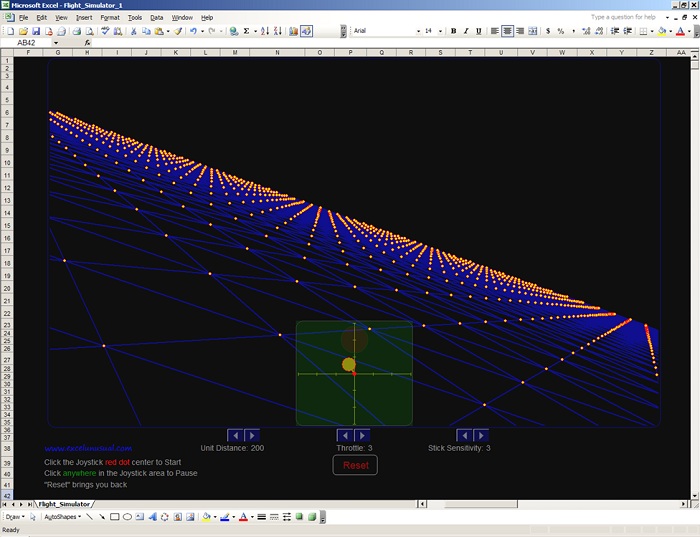
A First Flight Simulator Model in Excel
This is the first version of a 3D flight simulator in Excel. Start by adjusting the zoom on your file to fit the screen, so you can see the whole chart and the buttons underneath, then click “Reset” and then click the red dot in the center of the joystick. After that, the joystick handle will “stick” to your mouse pointer so… Read More... "A First Flight Simulator Model in Excel"
Flight Simulator Tutorial #3 – scene rotations and translation
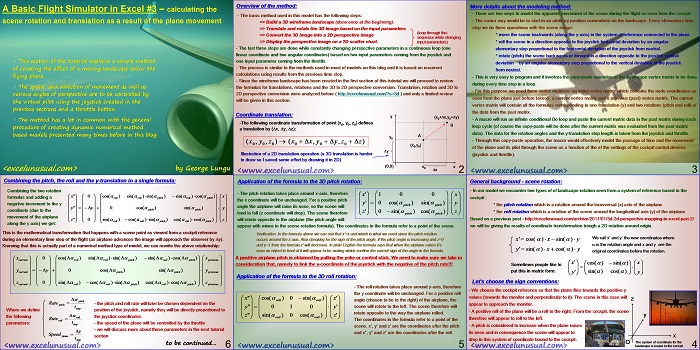
This section deals with a simple method of creating the appearance of scene movement during the flight. Beside reviewing standandard rotation and translation formulas described before on this blog, the presentation begins to explain how to apply numerical-like methods to create a live and interactive model. A Basic Flight Simulator in Excel #3 – calculating the scene rotation and translation as a result… Read More... "Flight Simulator Tutorial #3 – scene rotations and translation"
Flight Simulator Tutorial #2 – basic airplane positioning, control surfaces and turn dynamics
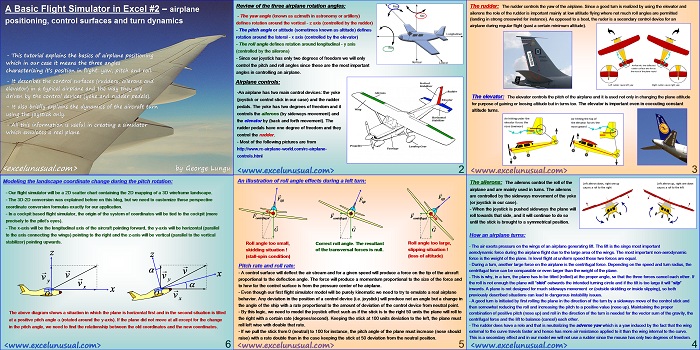
This is the second part of a tutorial explaining the creation of an “in-cockpit” flight simulator (versus the remote control simulator) model in Excel 2003. This section introduces some basic piloting background and nomenclature. A Basic Flight Simulator in Excel #2 – airplane positioning, control surfaces and turn dynamics by George Lungu – This tutorial explains the basics of airplane… Read More... "Flight Simulator Tutorial #2 – basic airplane positioning, control surfaces and turn dynamics"
Flight Simulator Tutorial #1 – the joystick and a ground mesh
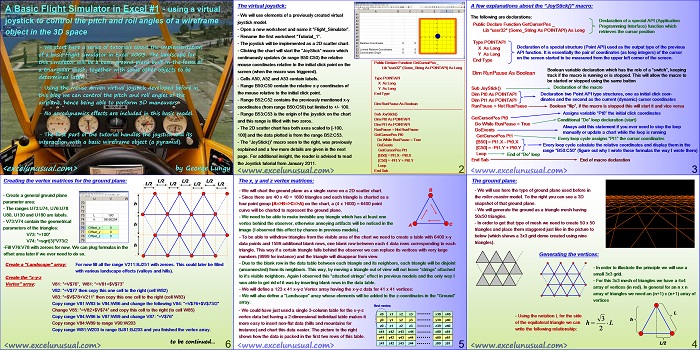
This is the first section of a tutorial explaining how to build a 3D flight simulator in Excel. This part deals with creating a joystick and a triangular ground mesh. The joystick model was explained in a previous post from January 2011 and the ground mesh was already used in the 3D roller-coaster. [sociallocker][/sociallocker] A Basic Flight Simulator in Excel #1 – using… Read More... "Flight Simulator Tutorial #1 – the joystick and a ground mesh"
How to make a game of PONG in Excel – part #10 – final
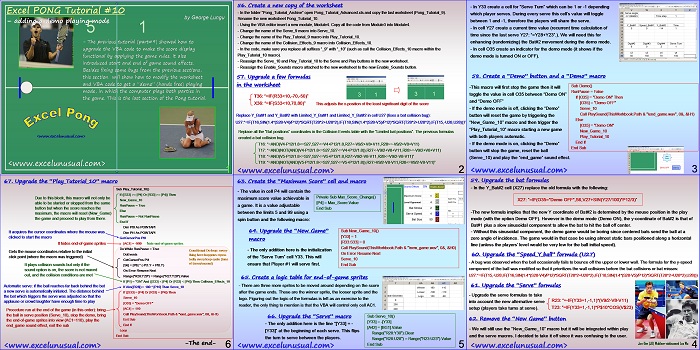
The previous section explained the VBA upgrades needed to make the score functional and new-game and end-game sound effects were added. This tutorial shows how fix some previous bugs and create a “demo play” option which means that both bats are automatically run by worksheet logic. This is the final part of the of the Pong tutorial series. [sociallocker][/sociallocker] Excel PONG Tutorial #10 – adding… Read More... "How to make a game of PONG in Excel – part #10 – final"