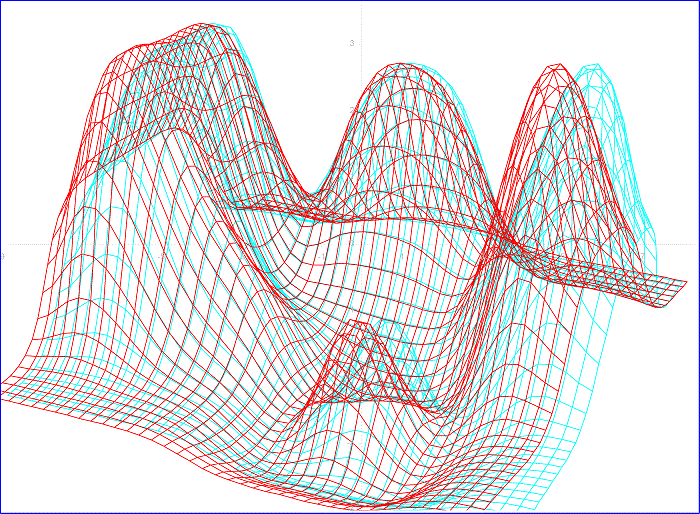
This is the final part of the anaglyph stereoscopy tutorial.
This part deals with the prectical implementation of the concepts and formulas discussed before to create a 3D cube.
You need 3D glasses to notice the stereoscopic effect.
The PDF erroneously claims this is part #3 of the tutorial, whereas this is actually part #4 (it’s a typo in the PDF).
Excel anaglyph stereoscopy #3 – 3D-2D perspective conversion formulas
by George Lungu
– While the previous section introduced the reader to the geometry and mathematical
calculations behind the anaglyph stereoscopy method, this section creates a basic model in a new
worksheet containing a stereoscopic rotating cube.
Excel implementation of the stereoscopy formulas – a couple of input parameters:
– In the “Stereoscopy_Tutorial” file copy the first worksheet (called 3D)
and rename the new worksheet “3D_Stereoscopy”.
– Insert two more input parameters: “Eye_Span” and “Collection_Span”
in range B12:B13. Range A12:A13 contains labels. Rename cells B12
“Eye_Span” and B13 “Collection_Span” and insert the constants you
see in the snapshot (you will experiment with those later).
The implementation of the 3D-2D perspective formulas:
– The v-coordinate formulas are already in the range H16:H34. Those
formulas are correct and we will leave them the way they are.
– Upgrade the table head labels to include “u_L” and “u_R” just like in
the snapshot to the right.
– Columns G and I will contain the formulas for u-L and u_R.
<excelunusual.com>
1
The implementation of the 3D-2D perspective formulas – continuation:
– In the formulas to the right (x,y,z) are the
Eye span xCollection span ES 2
coordinates of the target point in the object system of reference.
– ES is the distance between the plane where
the eyes of the observer are and the screen and
SO is the distance between the screen and the
origin of the object system of coordinates.
-Insert the u_L and u_R formulas:
– G16: “=-Eye_Span/2-(2*D16-Collection_Span)*Eye_Screen/(2*(Eye_Screen+Screen_Origin+E16))
– I16: “=Eye_Span/2-(2*D16+Collection_Span)*Eye_Screen/(2*(Eye_Screen+Screen_Origin+E16))
– Copy range G16:I16 down to row 34.
Chart the stereoscopic cube:
– Right now we already have a 2D scatter chart created. The chart has only one series taken
from the range G16:H34 (x from G and y from H).
– Rename the existing series “u_L”, make sure the color is “Light Turquoise”, choose the thickest
solid line and also make sure the line is not smoothed.
– Insert a new series: Right click the chart => Source Data => Add Series => Name: “u_R” =>
=> select the X_Values from range G16:G34 and the Y_Values from range H16:H34 => OK
– Make sure you select the color red for this curve also choose the thickest solid line and make
sure the line is not smoothed.
<excelunusual.com>
2
Charting the stereoscopic cube – continuation:
– You need to make sure that the plot area background is
white as the 3D effects are easy to see this way.
0.8
– You might wonder why the “Right” labeled curve is red
and the “Left” labeled curve is cyan, but the stereoscopic
0.5
glasses have the right lens cyan and the left curve red.
– The answer is simple, the two colors are
complementary, a lens can see only one of them. The red
0.2
lens passes red so the red curve will be invisible through
the red lens since it appears the same color as the white
1 -0.7 -0.4 -0.1 0.2 0.5 0.8
background (they look both red through the red lens). The -0.1
cyan curve however will appear black through the red,
lens therefore it will stand out on the white background.
-0.4
– By the same token the cyan lens passes the cyan
(turquoise) therefore the right eye will not see the
turquoise (cyan) since the background will appear
-0.7
turquoise through the same lens. The red trace will appear
black trough the cyan lens therefore the right eye will see
-1
the red trace, and that’s why the red trace is called “u_L”
because it’s seen by the left eye.
– You might ask then, how come that in our chart we see the trace to the left with the right eye and the trace
to the right with the left eye, and the answer to that is that in stereoscopy we watch the same object with both
eyes at the same time from different angles, therefore depending on the distance to the object our eyes are more
or less crossed (more for the close objects). In our Excel model we exacerbated that effect by choosing a wide
“Collection_span” then bringing the rays to the “Eyes_span” but leaving the convergence in the image.
– It’s not that hard at all, just come back and re-read this page a few times.
to be continued…
<excelunusual.com>
3


i like it..