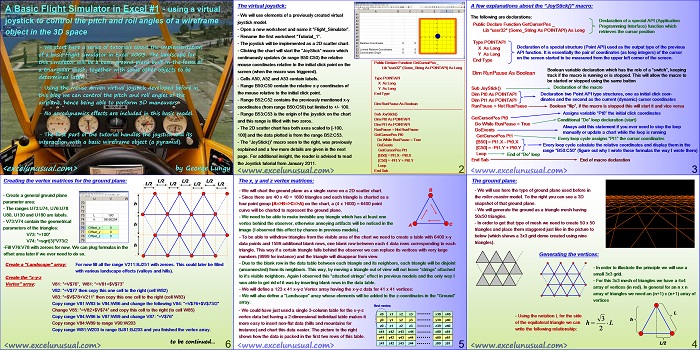
This is the first section of a tutorial explaining how to build a 3D flight simulator in Excel. This part deals with creating a joystick and a triangular ground mesh.
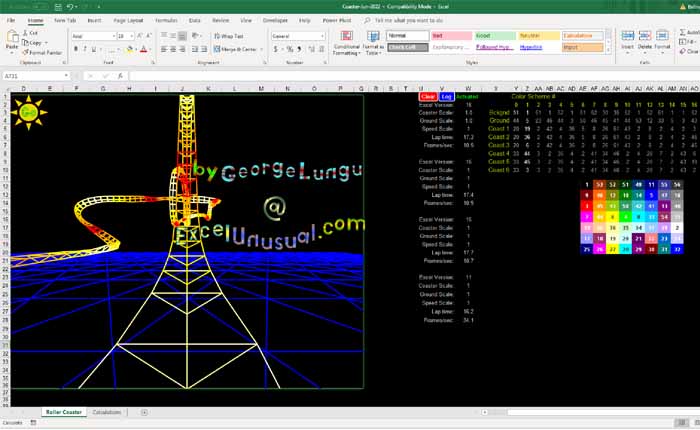
The joystick model was explained in a previous post from January 2011 and the ground mesh was already used in the 3D roller-coaster.
![]()
A Basic Flight Simulator in Excel #1 – using a virtual joystick to control the pitch and roll angles of a wireframe object in the 3D space
by George Lungu
– We start here a series of tutorials about the implementation
of a basic Flight simulator in Excel 2003. The landscape for
this simulator will be a basic ground plane built in the form of
a triangular mesh, together with some other objects to be
determined later.
– Using the mouse driven virtual joystick developed before in
this blog we can control the pitch and roll angles of the
airplane, hence being able to perform 3D maneuvers.
– No aerodynamics effects are included in this basic model.
– The first part of the tutorial handles the joystick and the
ground mesh.
<excelunusual.com> by George Lungu
The virtual joystick:
– We will use elements of a previously created virtual
joystick model.
– Open a new worksheet and name it “Flight_Simulator”.
– Rename the first worksheet “Tutorial_1”.
– The joystick will be implemented as a 2D scatter chart.
– Clicking the chart will start the “JoyStick” macro which
continuously updates (in range B50:C50) the relative mouse coordinates relative to the initial click point on the
– Cells A50, A52 and A53 contain labels.
– Range B50:C50 contain the relative x-y coordinates of screen (when the macro was triggered).
Public Declare Function GetCursorPos _
Lib “user32” (Some_String As POINTAPI) As Long
Type POINTAPI
X As Long
Y As Long
the mouse relative to the initial click point. End Type
– Range B52:C52 contains the previously mentioned x-y
Dim RunPause As Boolean coordinates (from range B50:C50) but limited to +/- 100.
—————————————————————————
– Range B53:C53 is the origin of the joystick on the chart Sub JoyStick()
Dim Pt0 As POINTAPI
and this range is filled with two zeros.
Dim Pt1 As POINTAPI
– The 2D scatter chart has both axes scaled to [-100, 100] and the data plotted is from the range B52:C53.
RunPause = Not RunPause
GetCursorPos Pt0
Do While RunPause = True
– The “JoyStick()” macro seen to the right, was previously explained and a few more details are given in the next page. For additional insight, the reader is advised to read the Joystick tutorial from January 2011.
DoEvents
GetCursorPos Pt1
[B50] = Pt1.X – Pt0.X
[C50] = -Pt1.Y + Pt0.Y
Loop
End Sub
<excelunusual.com> 2
A few explanations about the “JoyStick()” macro:
The following are declarations:
Declaration of a special API (Application
Public Declare Function GetCursorPos _
Programming Interface) function which
Lib “user32” (Some_String As POINTAPI) As Long
retrieves the cursor position
Type POINTAPI
Declaration of a special structure (Point API) used as the output type of the previous
X As Long
API function. It is essentially the pair of coordinates (as long integers) of the cursor
Y As Long
on the screen started to be measured from the upper left corner of the screen.
End Type
Boolean variable declaration which has the role of a “switch”, keeping
Dim RunPause As Boolean
track if the macro is running or is stopped. This will allow the macro to
be started or stopped using the same button
Declaration of the macro
Sub JoyStick()
Dim Pt0 As POINTAPI Declaration two Point API type structures, one as initial click coor-
Dim Pt1 As POINTAPI dinates and the second as the current (dynamic) cursor coordinates
RunPause = Not RunPause Boolean “flip”, if the macro is stopped this will start it and vice versa
Assigns variable “Pt0” the initial click coordinates
GetCursorPos Pt0
Conditional “Do” loop declaration (start)
Do While RunPause = True
Always add this statement if you ever need to stop the loop
DoEvents
manually or update a chart while the loop is running
GetCursorPos Pt1
Every loop cycle assigns “Pt1” the cursor coordinates
[B50] = Pt1.X – Pt0.X
Every loop cycle calculate the relative coordinates and display them in the
[C50] = -Pt1.Y + Pt0.Y
range “B50:C50” (figure out why I wrote those formulas the way I wrote them)
Loop End of “Do” loop
End Sub – End of macro declaration
<excelunusual.com> 3
The ground plane:
– We will use here the type of ground plane used before in
the roller coaster model. To the right you can see a 3D
snapshot of that ground plane.
– We will generate the ground as a triangle mesh having
40×40 triangles.
– In order to get that type of mesh, we need to create 40 x 40
triangles and place them staggered just like in the picture to
below (which shows a small 3×3 grid demo created using
nine triangles).
Generating the vertices:
– In order to illustrate the principle we will use a
small 3×3 grid.
– For this 3×3 mesh of triangles we have a 4×4
array of vertices (in red). In general for an n x n
array of triangles we need an (n+1) x (n+1) array of
vertices
– Using the notation L for the side of the equilateral triangle we can write the following relationship:
L/2
<excelunusual.com> 4
The x, y and z vertex matrices:
– We will chart the ground plane as a single curve on a 2D scatter chart. B
– Since there are 40 x 40 = 1600 triangles and each triangle is charted as a
four point group (A=>B=>C=>A) on the chart, a (4 x 1600) = 6400 point
curve will be charted to represent the ground plane.
– We need to be able to make invisible any triangle which has at least one
vertex behind the observer, otherwise annoying artifacts will be noticed in the image (I observed this effect by chance in previous models).
– To be able to withdraw triangles from the visible area of the chart we need to create a table with 6400 x-y
data points and 1599 additional blank rows, one blank row between each 4 data rows corresponding to each
triangle. This way if a certain triangle falls behind the observer we can replace its vertices with very large
numbers (9999 for instance) and the triangle will disappear from view.
– Due to the blank row in the data table between each triangle and its neighbors, each triangle will be disjoint
(unconnected) from its neighbors. This way, by moving a triangle out of view will not leave “strings” attached
to it’s visible neighbors. Again I observed this “attached strings” effect in previous models and the only way I
was able to get rid of it was by inserting blank rows in the data table.
– We will define a 123 x 41 x-y-z Vertex array having the x-y-z data for 41 x 41 vertices:
– We will also define a “Landscape” array whose elements will be added to the z-coordinates in the “Ground” array.
first vertex
– We could have just used a single 3-column table for the x-y-z vertex data but having a 2-dimensional individual table makes it more easy to insert non-flat data (hills and mountains for
instance) and chart this data easier. The picture to the rigt shows how the data is packed in the first two rows of this table.
y41 y42 y43 y44 y80 y81
z41 z42 z43 z44 z80 z81
<excelunusual.com> 5
Creating the vertex matrices for the ground plane:
– Create a general ground plane
parameter area:
– The ranges U73:U74, U76:U78
U80, U130 and U180 are labels.
– V73:V74 contain the geometrical parameters of the triangles:
V73: “=100”
V74: “=sqrt(3)*V73/2
h
-Fill V76:V78 with zeroes for now. We can plug formulas in the
offset area later if we ever need to do so.
Create a “Landscape” array: For now fill all the range V211:BJ251 with zeroes. This could later be filled
with various landscape effects (valleys and hills).
Create the “x-y-z
Vertex” array: V81: “=V$76”, W81: “=V81+$V$73”
V82: “=V$77 then copy this one cell to the right (cell W82)
V83: “=$V$78+V211” then copy this one cell to the right (cell W83)
Copy range V81:W83 to V84:W86 and change the following V84: “=V$76+$V$73/2”
Change V85: “=V82+$V$74” and copy this cell to the right (to cell W85)
Copy range V84:W86 to V87:W89 and change V87: “=V$76”
Copy range V84:W89 to range V90:W203
Copy range W81:W203 to range BJ81:BJ203 and you finished the vertex array.
to be continued…
by George Lungu <excelunusual.com> 6


Postscript: So that I do not leave you with enigmatic statements, the groundmesh could be produced with something akin to a knitting pattern.
First row
Moving right to produce alternate ‘saw teeth’:
Across, up, down, … across, up, down
Moving left to infill missing saw teeth:
Back, up, down, …., back, up
Next row
Until finish
Once you have a suitable pattern for your reference groundmesh there is no need to recalculate it. Copy and ‘paste values’ will provide a fixed array as the basis for further transformations.
That’s what I am doing now. You describe the same thing from a “linear” programming point of view. The ground is not being recalculated. It’s fixed already. It has few parameters in it, yes but it’s fixed until one changes the pitch. or the offset. And those will change. I really see no point here. What takes 99% of calculations is the rotations & translation of a fixed ground. Nothing you see on u-v coordinates (screen) is fixed. Constantly calculating the new positions and displaying them it’s what takes time and computing power.
George
You may feel like strangling me for this but I have some fresh ideas for you to experiment with.
I see two problems with your ground mesh. The first is that as your flight continues you will eventually fly out of the region covered by the mesh. The second is that much of the mesh will be behind the viewpoint which creates the spurious points that you have had to suppress (there is a third problem but that can wait).
The solution might be to translate the ground mesh by an integer number of meshspacings to ensure the rendered ground lies entirely infront of the viewpoint. The sense of movement will be derived from small increments of the viewing parameters; the larger integer changes will not be apparent because the new triangles will exactly overlay other triangles from the previous rendering.
This also means that you can draw your groundmesh with a single continuous line – no breaks needed.
Peter
Peter, thanks for the comment. I know that and I’ve been thinking about it for few months now. The temptation was high but I postponed it since I don’t see much value in it, at least not in the introductory version. I need to have a finite grid (my 299$ simulator does it). Think about seeing the mirage in the dessert, you see the lake and the more you go the farther it gets keeping at a constant distance. It sucks. There is nothing wrong with “exploring the edges of the grid. As I said I am working on something like that but as I am flying farther the relief shapes will change. I need to iron out few things though and I will not include it in my introductory model. I am also working on a progressively less dense grid as one flies farther, also with the possibility of increasing the density around the vicinity of the plane. This is in line with how the eye works (perceiving less details in the distance).
What you say in the second part is just having a large fixed grid and DISPLAYING a subset of it. Another thing I am working on but it won’t be here. Sorry. The tutorial will be pretty long already and I won’t focus on these fine details. It will also be quite slow on 2007 if usable at all.
Please review your very last statement. I refrain from commenting on that one. I just say, I would like to have a new virgin waking me up every morning. They used that idea in the first video games. I’ve seen that on Youtube a few months ago. The machines were weak at that time and they had certain driving games where it was possible to do that. The road was just a rectangle. Actually the idea has some merit in perfectly flat conditions but to implement it right it can be hard since the number and position of vertices changes all the time. I suggest that you create an example. That’s what I started to do for the coaster initially, but then I gave up and did it like everyone else, with triangles.
Herzlichen Dank, Marek! Tschüß, Georg
Thanks, Vladimir. It is going to be a very basic one not a masterpiece (perspective rotations and translations over a triangular mesh). To prove the principle…
Hello George, I can’t wait to see your new masterpiece..Looking forward to seeing your Flight Simulator !