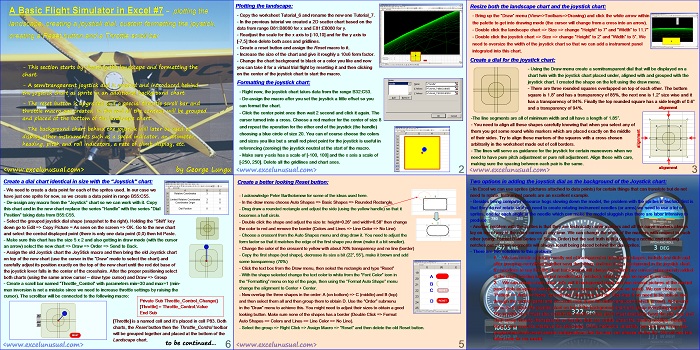
This section displays the landscape on a 2D scatter chart and also upgrades the joystick chart by adding a dial behind the joystick image.
This technique of using a stack of a back chart to display dial sprites and a front chart with transparent background to display various control devices, indicator needles and text will extensively be used in this and future models.
A Basic Flight Simulator in Excel #7 – plotting the
landscape, creating a joystick dial, custom formatting the joystick,
creating a Reset button and a Throttle scroll bar
by George Lungu
– This section starts by charting the landscape and formatting the
chart.
– A semitransparent joystick dial is created and introduced behind
the joystick chart as sprite in an additional background chart.
– The reset button is upgraded and a special throttle scroll bar and
throttle macro are created. In the end all the controls will be grouped
and placed at the bottom of the landscape chart.
– The background chart behind the joystick will later be used to
display other instruments such as a speed indicator, an altimeter,
heading, pitch and roll indicators, a rate of climb display, etc.
<excelunusual.com>
Plotting the landscape:
– Copy the worksheet Tutorial_6 and rename the new one Tutorial_7.
– In the previous tutorial we created a 2D scatter chart based on the
data from range B81:B8080 for x and E81:E8080 for y.
– Readjust the scale for the x axis to [-10,10] and for the y axis to
[-7,5] then delete both axes and gridlines.
– Create a reset button and assign the Reset macro to it.
– Increase the size of the chart and give it roughly a 10×6 form factor.
-Change the chart background to black or a color you like and now you
can take it for a virtual trial flight by resetting it and then clicking on
the center of the joystick chart to start the macro.
Formatting the joystick chart:
– Right now, the joystick chart takes data from the range B32:C53.
– De-assign the macro after you set the joystick a little offset so you
can format the chart.
– Click the center point once then wait 2 second and click it again. The
cursor turned into a cross. Choose a red marker for the center of size 8
and repeat the operation for the other end of the joystick (the handle)
choosing a blue circle of size 20. You can of course choose the colors
and sizes you like but a small red pivot point for the joystick is useful in
referencing (zeroing) the joystick neutral at the start of the macro.
– Make sure y-axis has a scale of [-100, 100] and the x axis a scale of
[-250, 250]. Delete all the grid lines and chart axes.
Resize both the landscape chart and the joystick chart:
– Bring up the “Draw” menu (View=>Toolbars=>Drawing) and click the white arrow within
the palette to get into drawing mode (the cursor will change from a cross into an arrow).
– Double click the landscape chart => Size => change “Height” to 7” and “Width” to 11.7”
– Double click the joystick chart => Size => change “Height” to 2” and “Width” to 5”. We
need to oversize the width of the joystick chart so that we can add a instrument panel
integrated into this chart.
Create a dial for the joystick chart:
– Using the Draw menu create a semitransparent dial that will be displayed on a
chart twin with the joystick chart placed under, aligned with and grouped with the
joystick chart. I created the shape on the left using the draw menu.
– There are three rounded squares overlapped on top of each other. The bottom
square is 1.8” and has a transparency of 85%, the next one is 1.2” size wise and it
has a transparency of 94%. Finally the top rounded square has a side length of 0.6”
and a transparency of 94%. alignment
-The line segments are all of minimum width and all have a length of 1.85”.
– You need to align all these shapes carefully knowing that when you select any of
them you get some round white markers which are placed exactly on the middle
of their sides. Try to align these markers of the squares with a cross chosen
arbitrarily in the worksheet made out of cell borders.
– The lines will serve as guidance for the joystick for certain maneuvers when we
need to have pure pitch adjustment or pure roll adjustment. Align these with care,
making sure the spacing between each pair is the same.
alignment
Two options in adding the joystick dial as the background of the Joystick chart:
– In Excel we can use sprites (pictures attached to data points) for certain things that can translate but do not
need to rotate. Instrument panels are an excellent example.
– Besides being computer resource hogs slowing down the model, the problem with the sprites is twofold, first is
that they do not rotate so if we need to create rotating instrument needles (or arms) we need to use a lot of
sprites, one for each angle of the needle which can make the model sluggish plus there are labor intensive to
produce.
– Another problem with the sprites is that they are technically curve markers and all the curve markers always
lay on top of any of the chart curves at any time. We can change the order of the markers with respect to each
other (using: Format Data Series => Series Order) but the sad truth is that creating a needle and rotating
notches out of curve segments will always result being placed behind the dial sprites.
There are two solutions to this problem:
1. We can create a picture mostly out of transparent or translucent shapes, include few dials and
after grouping everything together save the picture and use it as a background in the joystick chart.
It’s needless to say that the chart background will always be behind any curves subsequently added
to the chart (rotating instrument needles and notches), which is what we need in our case.
2. We can create a twin chart, let’s call it background chart and use several pictures of the control
panel dials as sprites (which we can move around in any position we need). We can choose a
“Pattern => Area => None” for both the Chart Area and the Plot Area if we need to be able to see
through the control panel and we could even draw the dials translucent (which is cool).
At the end we need to stack the joystick chart on top of the background chart and group everything together.
The joystick chart must also contain the needle curves and it must absolutely have the plot area and
chart areas missing (transparent) so that the dials are visible under the rotating needles.
Despite being more resource intensive the advantage of this method is versatility (we can have many pre-
programmed instrument panels configurations that the user can choose on-the-fly). We will use this
latter case for our model.
Create a better looking Reset button:
– I acknowledge Peter Bartholomew for some of the ideas used here.
– In the draw menu choose Auto Shapes => Basic Shapes => Rounded Rectangle.
– Drag draw a rounded rectangle and adjust the side (using the yellow handle) so that it
becomes a half circle.
– Double click the shape and adjust the size to: height=0.26” and width=0.58” then change
the color to red and remove the border (Colors and Lines => Line Color => No Line)
– Choose a crescent from the Auto Shapes menu and drag draw it. You need to adjust the
form factor so that it matches the edge of the first shape you drew (make it a bit smaller).
– Change the color of the crescent to yellow with about 70% transparency and no line (border)
– Copy the first shape (red shape), decrease its size a bit (22”, 55’), make it brown and add
some transparency (70%)
– Click the text box from the Draw menu, then select the rectangle and type “Reset”
– With the shape selected change the text color to white from the “Font Color” icon in the “Formatting” menu on top of the page, then using the “Format Auto Shape” menu change the alignment to
– Now overlap the three shapes in the order: A (on bottom) => C (middle) and B (top)
and then select them all and then group them to obtain D. Use the “Order” sub-menu in the “Draw” menu to achieve this. You might need to adjust their sizes to obtain a good
looking button. Make sure none of the shapes has a border (Double Click => Format Auto Shapes => Colors and Lines => Line Color => No Line).
– Select the group => Right Click => Assign Macro => “Reset” and then delete the old Reset button.
Create a dial chart identical in size with the “Joystick” chart:
– We need to create a data point for each of the sprites used. In our case we
have just one sprite for now, so we create a data point in range B55:C55.
– De-assign any macro from the “Joystick” chart so we can work with it. Copy
this chart and in the new chart replace the series “Handle” with the series “Dial
Position” taking data from B55:C55.
– Select the grouped joystick dial shape (snapshot to the right). Holding the “Shift” key
down go to Edit => Copy Picture = As seen on the screen => OK. Go to the new chart
and select the central displayed point (there is only one data point (0,0) then hit Paste.
– Make sure this chart has the size 5 x 2 and also getting in draw mode (with the cursor
an arrow) select the new chart => Draw => Order => Send to Back.
– Assign the old Joystick chart the JoyStick macro and then bring the old Joystick chart
on top of the new chart (use the cursor in the “Draw” mode to select the chart) and
carefully adjust its position exactly on the top of the new chart until the red dot base of
the joystick lever falls in the center of the crosshairs. After the proper positioning select
both charts (using the same arrow cursor – draw type cursor) and Draw => Group
– Create a scroll bar named “Throttle_Control” with parameters min=30 and max=1 (min-
max inversion is not a mistake since we need to increase throttle settings by raising the
cursor).
The scrollbar will be connected to the following macro:
Private Sub Throttle_Control_Change()
[Throttle] = Throttle_Control.Value
End Sub
[Throttle] is a named cell and it’s placed in cell P83. Both
charts, the Reset button then the Throttle_Control toolbar
will be grouped together and placed at the bottom of the Landscape chart.
to be continued…


Hey George, I’ve noticed that you uploaded the pdf file for tutorial #6 here again, instead of #7. I wonder if you could change the file.
Regards
I don’t see anything major but when I find spelling mistakes or I don’t like something I upgrade. Usually when there is a major formula or something deeper than a spelling error I add a note in red. Anyway just use the new one. Nothing here is guaranteed to be right especially since I am going quite fast with these tutorials. If you find something wrong please let me know. George
Sorry I think I did not make my point here. What I was trying to say is that when I click the “pdf file” button, it sends me to tutorial #6 instead of #7. It is only necessary to change the number in the address bar to see it (perhaps this only happens to me). In any case the link is the only thing that is not working correctly.
I corrected it and now it’s visible. I usually verify everything before and after posting but now I missed it. Thanks for the notice, George