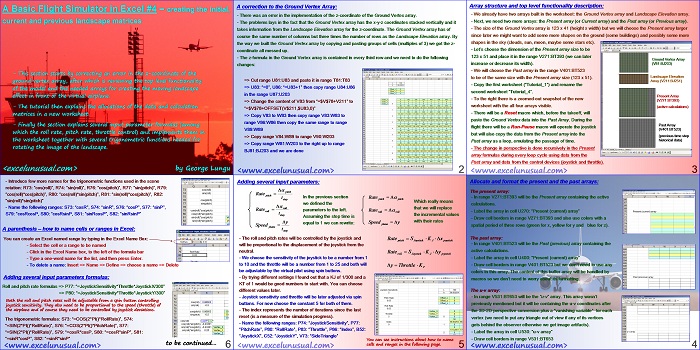
This section explains the top level functionality of the model, it also allocates the data and formula arrays needed for manipulating the scene image.
The roll rate, pitch rate and throttle formulas are implemented in the worksheet.
![]()
A Basic Flight Simulator in Excel #4 – creating the initial, current and previous landscape matrices
by George Lungu
– This section starts by correcting an error in the z-coordinate of the
ground vertex array, after which is reviewing the top level functionality
of the model and the needed arrays for creating the moving landscape
effect in front of the virtual airplane.
– The tutorial then explains the allocations of the data and calculation
matrices in a new worksheet.
– Finally the section explains several input parameter formulas (among
which the roll rate, pitch rate, throttle control) and implements them in
the worksheet together with several trigonometric functions needed for
rotating the image of the landscape.
<excelunusual.com> by George Lungu
A correction to the Ground Vertex Array:
– There was an error in the implementation of the z-coordinate of the Ground Vertex array.
– The problems lays in the fact that the Ground Vertex array has the x-y-z coordinates stacked vertically and it
takes information from the Landscape Elevation array for the z-coordinate.
The Ground Vertex array has of course the same number of columns but three times the number of rows as the Landscape Elevation array.
By the way we built the Ground Vertex array by copying and pasting groups of cells (multiples of 3) we got the z-
coordinate all messed up.
– The z-formula in the Ground Vertex array is contained in every third row and we need to do the following
changes:
=> Cut range U81:U83 and paste it in range T81:T83
=> U83: “=0”, U86: “=U83+1” then copy range U84:U86 in the range U87:U203
=> Change the content of V83 from “=$V$78+V211” to
“=$V$78+OFFSET(V$211,$U83,0)”
=> Copy V83 to W83 then copy range V83:W83 to
range V86:W86 then copy the same range to range
V89:W89
=> Copy range V84:W89 to range V90:W203
=> Copy range W81:W203 to the right up to range
BJ81:BJ203 and we are done
<excelunusual.com> 2
Array structure and top level functionality description:
– We already have two arrays built in the worksheet: the Ground Vertex array and Landscape Elevation array.
– Next, we need two more arrays: the Present array (or Current array) and the Past array (or Previous array).
– The size of the Ground Vertex array is 123 x 41 (height x width) but we will choose the Present array larger
since later we might want to add some more shapes on the ground (some buildings) and possibly some more
shapes in the sky (clouds, sun, moon, maybe some stars etc).
– Let’s choose the dimension of the Present array size to be
123 x 51 and place it in the range V271:BT393 (we can later
Ground Vertex Array
increase or decrease its width). (V81:BJ203)
– We will choose the Past array in the range V401:BT523
Landscape Elevation to be of the same size with the Present array size (123 x 51).
Array (V211:BJ251)
– Copy the first worksheet (“Tutorial_1”) and rename the second worksheet “Tutorial_4”.
Present Array
– To the right there is a zoomed-out snapshot of the new worksheet with the all four arrays visible. (active calculations)
– There will be a Reset macro which, before the takeoff, will
paste the Ground Vertex data into the Past Array. During the
Past Array
flight there will be a Run-Pause macro will operate the joystick but will also copy the data from the Present array into the Past array as a loop, emulating the passage of time.
(previous time step historical data)
– The change in perspective is done recursively in the Present array formulas during every loop cycle using data from the Past array and data from the control devices (joystick and throttle).
<excelunusual.com> 3
Allocate and format the present and the past arrays:
The present array:
– In range V271:BT393 will be the Present array containing the active calculations.
– Label the array in cell U270: “Present (current) array”
– Draw cell borders in range V271:BT393 and also use colors with a
spatial period of three rows (green for x, yellow for y and blue for z).
The past array:
– In range V401:BT523 will be the Past (previous) array containing the active calculations.
– Label the array in cell U400: “Present (current) array”
– Draw cell borders in range V401:BT523 but we don’t need to use any
colors in this array. The content of this buffer array will be handled by
macros so we don’t need to worry about its formatting.
The u-v array:
– In range V531:BT653 will be the “u-v” array. This array wasn’t
previously mentioned but it will be containing the u-v coordinates after
the 3D-2D perspective conversion plus a “vanishing variable” for each
vertex (we need to put any triangle out of view if any of its vertices
gets behind the observer otherwise we get image artifacts).
– Label the array in cell U530: “u-v array”
– Draw cell borders in range V531:BT653
by George Lungu <excelunusual.com>
Adding several input parameters:
In the previous section Rate
step pitch pitch
Which really means
we defined the
roll that we will replace
Rateroll parameters to the left. Rateroll
roll
step the incremental values
Assuming the step time is
with their rates
Dy equal to 1 we can rewrite: Speed
– The roll and pitch rates will be controlled by the joystick and will be proportional to the displacement of the joystick from the neutral. The minus in the pitch rate formula comes from the fact that a positive plane pitch is achieved with a negative Dy of the joystick.
– We choose the sensitivity of the joystick to be a number from 1 to 10 and the throttle will be a number from 1 to 25 and both will be
adjustable by the virtual pilot using spin buttons.
– By trying different settings I found out that a KJ of 1/300 and a KT
of 1 would be good numbers to start with. You can choose different
values later.
– Joystick sensitivity and throttle will be later adjusted via spin
buttons. For now choose the constant 5 for both of them.
– The index represents the number of iterations since the last reset
(is a measure of the simulation progress).
– Name the following ranges: P74: “JoystickSensitivity”, P77:
“PitchRate”, P80: “RollRate”, P83: “Throttle”, P86: “Index”, B52:
“JoystickX”, C52: “JoystickY”, V73: “SideTriangle”
You can see instructions about how to name cells and ranges in the following page.
<excelunusual.com> 5
– Introduce few more names for the trigonometric functions used in the scene
rotation: R73: “cos(roll)”, R74: “sin(roll)”, R76: “cos(pitch)”, R77: “sin(pitch)”, R79:
“cos(roll)*cos(pitch)”, R80: “cos(roll)*sin(pitch)”, R81: “sin(roll)*cos(pitch)”, R82:
“sin(roll)*sin(pitch)”
– Name the following ranges: S73: “cosR”, S74: “sinR”, S76: “cosP”, S77: “sinP”,
S79: “cosRcosP, S80: “cosRsinP, S81: “sinRcosP”, S82: “sinRsinP”
A parenthesis – how to name cells or ranges in Excel:
You can create an Excel named range by typing in the Excel Name Box:
– Select the cell or a range to be named
– Click in the Excel Name box, to the left of the formula bar
– Type a one-word name for the list, and then press Enter.
– To delete a name: Insert => Name => Define => choose a name => Delete
Adding several input parameters formulas:
Roll and pitch rate formulas => P77: “=-JoystickSensitivity*Throttle*JoystickY/300”
=> P80: “=JoystickSensitivity*Throttle*JoystickX/300”
Both the roll and pitch rates will be adjustable from a spin button controlling
joystick sensitivity.
They also need to be proportional to the speed (throttle) of
the airplane and of course they need to be controlled by joystick deviations.
The trigonometric formulas: S73: “=COS(2*PI()*RollRate/180)”,
S74: “=SIN(2*PI()*RollRate/180)”, S76: “=COS(2*PI()*PitchRate/180)”,
S77: “=SIN(2*PI()*PitchRate/180)”, S79: “=cosR*cosP,
S80: “=cosR*sinP”, S81: “=sinR*cosP”, S82: “=sinR*sinP”
You can see that we converted the pitch and roll rates in radians!
to be continued…
by George Lungu <excelunusual.com> 6


George
I am getting about 3 fps on the first model with Excel 2010 on a core i3 desktop (2 core running 32 bit Windows).
I put your area chart behind the scatter chart and visually it works well in providing a night sky (don’t know what the sun is doing there!) I think this will be worthwhile particularly if you move to fewer triangles for your ground mesh. As it is, there were times when I couldn’t tell whether I was flying inverted or whether I was in subterranean flight looking up – somewhat disorienting!
I also tried changing your sequentially applied rotations by small angle approximations. Numerically the differences were in the 5 decimal place so made no difference at first but the errors could accumulate until the point where your resulting large transformation is no longer a pure rotation. Not worth the risk.
Thanks, Peter. You have a very nice machine there. It’s good you tried the surface chart. I will use it for sure (the idea is priceless) but now I am swamped with work. The problem is not the decimals but cos is not 1. Use sin=alpha and cos = sqtr(1-alpha^2) and it shuouldn’t break down. You can also use a taylor expansion of 2-3 terms of you wish. If you put cos=1 it’s like cursing to heaven. Anyway check for speed too, I bet you don’t gain anything significant (probably less than a couple of percent.
For the area chart you just need values for v corresponding to u=-5.0 and +5.0 (I did 0.0 too). These values frequently lie well outside the v range of -3.0 to +3.0 but this is not an issue. An extra dataset is needed to put the correct colors in place for inverted flight.
Limiting the range is hard. Even if you don’t see any lines (you are flying up vertically) the model is slow. Somehow the total number of virtually displayable points (seen or unseen) slows the model down. When you are far away you can see them all so you cannot plot just a subset.
I wasn’t expecting replies Easter weekend!
There are two issues running here. I was looking at the area chart which could be used used to provide the basic ground/sky reference and the equivalent artificial horizon instrument. These require straight lines to two points will do.
I calculated the screen v at which the horizon intersects the edge of the viewport from the condition that the horizon is 90deg away from the zenith.
Well it was mostly last night and I managed to get away without the after midnight supper at the church.
Unfortunately I am not able to answer this one since I have not done any work yet. I am sure it can be done but I need to take at least one day maybe more. For sure 2 points are enough and sometimes all you see is ground or sky. The instruments are closer to implementation than anything else and I know how to do it but not to the last detail yet. It’s a good practice to document (in tutorials) everything before moving on to implement a new feature. It seems slow but it si actually the best, the fastest and the safest way to do it (in the long run). I now go to the coaster for instance and don’t understand much of what I did. I don’t want to repeat the same mistake of rushing to implement a lot of things without good documentation.
I am concerned by your formula relating airspeed to engine throttle setting. The airspeed is more sensitive to the rate of climb/descent than it is to the throttle. The cyclist or downhill skier are constrained by terrain but the pilot can convert hieght into speed wherever he wishes.
I need to do that eventually. This can be easily adjusted in one of the next model to introduce friction (speed quadratic) and a gravity force, but my first model is “in space” (no gravity yet). It will take just a couple of more formulas after I extract the pitch angle from the scene. Which version of Excel are you using?
Just checking – hope you don’t think I am being rude. Without such effects you would achieve something more akin to a highway in the sky than flight.
I use Office 2010. I did install a copy of 2003 on a netbook in order to change color charts back to black and white patterns (a deprecated feature in 2010!) prior to publication but the machine is very limited.
Do you by any chance see an improvement in speed from 2007 to 2010? I mean mostly for files with large charts like the flight simulator.
How fast (fps) does the model run on your machine on 2007?