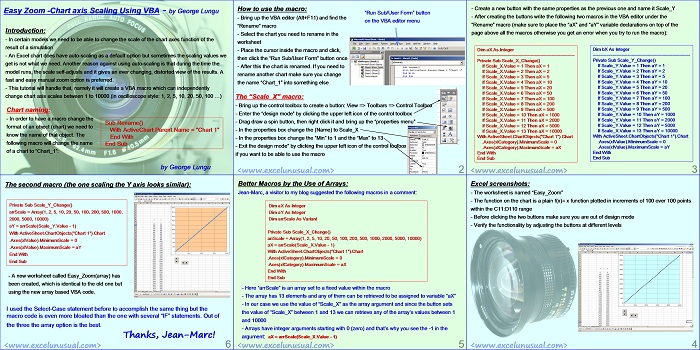
In certain models we need to be able to change the scale of the chart axes function of the result of a simulation.
Excel charts do have auto-scaling as a default option but sometimes the scaling values we get are not what we need. Another reason against using auto-scaling is that during the time the model runs, the scale self-adjusts and it gives an ever changing, distorted view of the results.
A fast and easy manual zoom option is preferred. This tutorial will handle that, namely it will create a VBA macro which can independently change chart axis scales between 1 to 10000 (in oscilloscope style: 1, 2, 5, 10, 20, 50, 100 …). Thanks, Jean-Marc for your VBA suggestions.
Easy Zoom -Chart axis Scaling Using VBA
– by George Lungu
Introduction:
– In certain models we need to be able to change the scale of the chart axes function of the
result of a simulation
– An Excel chart does have auto-scaling as a default option but sometimes the scaling values we
get is not what we need. Another reason against using auto-scaling is that during the time the
model runs, the scale self-adjusts and it gives an ever changing, distorted view of the results. A
fast and easy manual zoom option is preferred.
– This tutorial will handle that, namely it will create a VBA macro which can independently
change chart axis scales between 1 to 10000 (in oscilloscope style: 1, 2, 5, 10, 20, 50, 100 …)
Chart naming:
– In order to have a macro change the format of an object (chart) we need to know the name of that object. The following macro will change the name of a chart to “Chart_1”:
Sub Rename()
With ActiveChart.Parent.Name = “Chart 1”
End With
End Sub
by George Lungu
<excelunusual.com>
How to use the macro:
– Bring up the VBA editor (Alt+F11) and find the “Rename” macro
– Select the chart you need to rename in the worksheet
– Place the cursor inside the macro and click, then click the “Run Sub/User Form” button once
– After this the chart is renamed. If you need to rename another chart make sure you change
the name “Chart_1” into something else
“Run Sub/User Form” button on the VBA editor menu
The “Scale_X” macro:
– Bring up the control toolbox to create a button: View => Toolbars => Control Toolbox
– Enter the “design mode” by clicking the upper left icon of the control toolbox
– Drag draw a spin button, then right click it and bring up the “properties menu”
– In the properties box change the (Name) to Scale_X
– In the properties box change the “Min” to 1 and the “Max” to 13
– Exit the design mode” by clicking the upper left icon of the control toolbox
if you want to be able to use the macro
– Create a new button with the same properties as the previous one and name it Scale_Y
– After creating the buttons write the following two macros in the VBA editor under the
“Rename” macro (make sure to place the “aX” and “aY” variable declarations on top of the
page above all the macros otherwise you get an error when you try to run the macro):
Dim aX As Integer
—————————————————————–
Private Sub Scale_X_Change()
If Scale_X.Value = 1 Then aX = 1
If Scale_X.Value = 2 Then aX = 2
If Scale_X.Value = 3 Then aX = 5
If Scale_X.Value = 4 Then aX = 10
If Scale_X.Value = 5 Then aX = 20
If Scale_X.Value = 6 Then aX = 50
If Scale_X.Value = 7 Then aX = 100
If Scale_X.Value = 8 Then aX = 200
If Scale_X.Value = 9 Then aX = 500
If Scale_X.Value = 10 Then aX = 1000
If Scale_X.Value = 11 Then aX = 2000
If Scale_X.Value = 12 Then aX = 5000
If Scale_X.Value = 13 Then aX = 10000
With ActiveSheet.ChartObjects(“Chart 1”).Chart
.Axes(xlCategory).MinimumScale = 0
.Axes(xlCategory).MaximumScale = aX
End With
End Sub
Dim aX As Integer
—————————————————————–
Private Sub Scale_Y_Change()
If Scale_Y.Value = 1 Then aY = 1
If Scale_Y.Value = 2 Then aY = 2
If Scale_Y.Value = 3 Then aY = 5
If Scale_Y.Value = 4 Then aY = 10
If Scale_Y.Value = 5 Then aY = 20
If Scale_Y.Value = 6 Then aY = 50
If Scale_Y.Value = 7 Then aY = 100
If Scale_Y.Value = 8 Then aY = 200
If Scale_Y.Value = 9 Then aY = 500
If Scale_Y.Value = 10 Then aY = 1000
If Scale_Y.Value = 11 Then aY = 2000
If Scale_Y.Value = 12 Then aY = 5000
If Scale_Y.Value = 13 Then aY = 10000
With ActiveSheet.ChartObjects(“Chart 1”).Chart
.Axes(xlCategory).MinimumScale = 0
.Axes(xlCategory).MaximumScale = aY
End With
End Sub
Excel screenshots:
– The worksheet is named “Easy_Zoom”
– The function on the chart is a plain f(x)= x function plotted in increments of 100 over 100 points
within the C11:D110 range
– Before clicking the two buttons make sure you are out of design mode
– Verify the functionality by adjusting the buttons at different levels
Better Macros by the Use of Arrays:
Jean-Marc, a visitor to my blog suggested the following macros in a comment:
Dim aX As Integer
Dim aY As Integer
Dim arrScale As Variant
Private Sub Scale_X_Change()
arrScale = Array(1, 2, 5, 10, 20, 50, 100, 200, 500, 1000, 2000, 5000, 10000)
aX = arrScale(Scale_X.Value – 1)
With ActiveSheet.ChartObjects(“Chart 1”).Chart
.Axes(xlCategory).MinimumScale = 0
.Axes(xlCategory).MaximumScale = aX
End With
End Sub
– Here “arrScale” is an array set to a fixed value within the macro
– The array has 13 elements and any of them can be retrieved to be assigned to variable “aX”
– In our case we use the value of “Scale_X” as the array argument and since the button sets
the value of “Scale_X” between 1 and 13 we can retrieve any of the array’s values between 1
and 10000
– Arrays have integer arguments starting with 0 (zero) and that’s why you see the -1 in the
argument: aX = arrScale(Scale_X.Value – 1)
The second macro (the one scaling the Y axis looks similar):
Private Sub Scale_Y_Change()
arrScale = Array(1, 2, 5, 10, 20, 50, 100, 200, 500, 1000,
2000, 5000, 10000)
aY = arrScale(Scale_Y.Value – 1)
With ActiveSheet.ChartObjects(“Chart 1”).Chart
.Axes(xlValue).MinimumScale = 0
.Axes(xlValue).MaximumScale = aY
End With
End Sub
– A new worksheet called Easy_Zoom(array) has
been created, which is identical to the old one but it’s
using the new array based VBA code.
I used the Select-Case statement before to accomplish the same thing but the
macro code is even more bloated than the one with several “IF” statements. Out of
the three the array option is the best.
Thanks, Jean-Marc!
by George Lungu <excelunusual.com>


Thanks, Alex! I haven’t heard about the choose function :-), not until today. It seems useful. However Excel is of a secondary role on this blog. This blog is for engineering and science. Excel is unspoiled, no need for programming and it does not solve things for you like other black boxes around. That’s why I use Excel. I worked for many companies and I’ve also kept in touch with school for many years and no matter where you go the stoy is one: people refuse to use their mind. They continuously read something or take classes, burry themselves in books, papers, syntax, expensive software, teams of collaborators and all the crap they take from the outside. But they are afraid to use their mind and that’s why there is this prevalent impotence wherever you go. Unfortunately in some posts I give the impression that I want to teach Excel. I don’t and I don’t want to know any more Excel myself. I know more that enough. It there is a good way to do something don’t learn any more syntax. Learn some different science if you wish. Pick something you never heard before or you barely heard before, play with it, think it over for few days and make o model. It’s time much better spent than learning 5 more ways to do the same thing with the same result and same speed as the 5 ways you already know. Stacking garbage in the memory is not good for anyone, yet people do it since it gives them an excuse to overflow their mind with ballast so they don’t use it the way it was intended to be used for, and that is thinking.
Alex, I am not sure what you are talking about when you say “reading normal blogs can open your mind to solve the science problems”. I couldn’t find those blogs. I am not saying they don’t exist, I just have not found them. There are two approaches out there. There are people who take some books or courses from college and regurgitate that (see khan academy for instance) delivering the essentially same thing. People like this say “books are written from books”.The value in that is marginal unless one lives in a 3rd world country with no access to information. If it’s in th video form it might also be useful to a lot of kids nowadays who are TV educated and if they read more than few lines they fall asleep. Then there are people who produce something but don’t see the spirit. They created what they created by following a cookbook style approach and feel an urge to force others to follow the same methods rather than use their own judgement. This people will preach you the need of learning a new way of waxing a car every year and they see this as personal growth. What I also found, and I am getting this all the time, is people who call themselves various titles and who spend years “studying” some narrow topic to be able to solve some minor problems. A lot of this has to do with the current system including academia which what mostly teaches you is compliance and all this “revolutionary” software floating around. Now you can find lots of “techie blogs” which shows you how to apply the wax on the car the 7th way besides the 6 you know. What I am trying to do in this place is not teach people but poke them, maybe give them some ideas trying to make them think for themselves. And it might sound counterproductive but it’s the opposite: if you focus in one place you usually remain there. If you focus on ways of applying wax on cars all you are going to be is a wax polisher. You meet this everywhere around you, in science, in engineering, etc. Forget the old days, nowadays everyone is “specialized”, everyone is an “expert” and you meet all these experts with such a narrow expertise that when you integrate their “knowledge” you get very little. And you need a large team, large budget and large time line to do anything. You should focus on making the car and forgetting about the rules you learned. Free up your mind even if doing so it hurts. What many people like to say, break out of the box.
George, I think the variable declaration before Scale_Y_Change() should be
Dim aY as Integer
instead of
Dim bX as Integer
Thanks Reuvain, that is correct! I upgraded the PDF. Georges
Hi George,
Great post. I really like your site.
Here’s a suggestion to make your “Scale_X_Change” and “Scale_Y_Change” subs simpler and get rid of all the “If…”
First, create a variable :
Dim arrScale as variant
then in the 2 subs, replace all the IFs with this :
Private Sub Scale_X_Change()
arrScale = Array(1, 2, 5, 10, 20, 50, 100, 200, 500, 1000, 2000, 5000, 10000)
aX = arrScale(Scale_X.Value – 1)
With ActiveSheet.ChartObjects(“Chart 1″).Chart
.Axes(xlCategory).MinimumScale = 0
.Axes(xlCategory).MaximumScale = aX
End With
End Sub
Continue your good work!
Thanks Jean Mark! I will make a post including your code since this is important.
I’ve been looking for something like this. I hate wasting space. George
I have an addition to make here that makes the code even briefer, although I have only returned the scale factor to a cell in this code, this technique is just as easy to apply to a chart using JeanMarc’s With… End With construct above.
The technique involves reading the mantissa (1, 2 or 5) from an array and multiplying by 10 ^ exponent, where exponent is increased or decreased by 1 for every third click of the spin button. See my commented code below and feel free to use it folks.
Regards,
Don
Private Sub Scaler_Change()
‘ *************************************************************
‘ * Written by Don Love 5/5/2011 for excelunusual.com *
‘ * Calculates a scale factor to apply based on a spin *
‘ * button named Scaler set up with a min value of -30 *
‘ * a max value of 30. The result is placed in cell C4 *
‘ * but you could use it for scaling a chart’s axes *
‘ * magnifying a time step, etc *
‘ * Please copy and modify as you wish *
‘ *************************************************************
Dim base()
base = Array(1, 2, 5)
‘ Calculate the scale factor and place it in cell C4
‘ Scale factor = [ mantissa portion of result ] * 10 ^ [ exponent of result ]
Range(“C4”).Value = base((Scaler.Value + 30) Mod 3) * 10 ^ (Int(Scaler.Value / 3))
End Sub
Sorry all, it doesn’t make the code briefer, but it does extend the range for the scale factor to 1e-10 to 1e10 easily.
Don
Thanks Don! I appreciate your input.
By the way my original stereoscopy chart had a black background. Nothing would work with that. I experimented and some light colors work but white is the best. With white the cube comes out of the screen :-).
Re stereoscopy (analglyphic stereoscopy) which is not relevant to scaling chart axes in case other readers are wondering where this thread’s going!
In stereoscopy you need the white background because you need the line that’s the same colour as the lens on the “wrong eye” to disappear into the background and the same line to appear black or grey in the “correct eye”. This is the case for the red lines in the red eye (appear same as white does where the blue lines appear grey) and the cyan lines in the cyan eye (appear same as white when the red ones appear grey).
To make a line disappear into a black background, but appear bright for red/cyan lens colours will take a bit of experimentation and I don’t think the colour choices are possible in Excel 2003… sounds like a small challenge.
Cheers,
Don
The best initial try I had was with black chart area, make the aqua lines brown (one colour darker than full red on the colour grid) and the red lines navy blue (above the royal blue in the grid). But it’s nowhere near as effective as the white background combination.
Cheers,
Don
I will keep the background white. The 3D effects are very strong.