Most of the models on this blog are designed for Excel 2003 or earlier versions.
Sometimes however, Excel 2007 or 2010 are the only versions available even though they might be far slower when running these models.
This presentation is an introduction to Excel 2007 and it was suggested to me by one of my readers.
![]()
[sociallocker] ![]() [/sociallocker]
[/sociallocker]
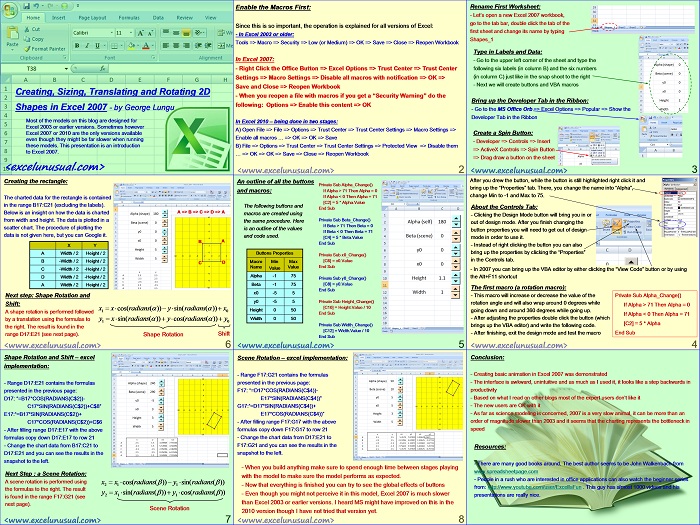
Creating, Sizing, Translating and Rotating 2D Shapes in Excel 2007 – by George Lungu
Most of the models on this blog are designed for
Excel 2003 or earlier versions.
Sometimes however Excel 2007 or 2010 are the only versions available
even though they might be far slower when running these models.
This presentation is an introductionto Excel 2007.
<excelunusual.com>
Enable the Macros First:
Since this is so important, the operation is explained for all versions of Excel:
– In Excel 2003 or older:
Tools => Macro => Security => Low (or Medium) => OK => Save => Close => Reopen Workbook
In Excel 2007:
– Right Click the Office Button => Excel Options => Trust Center => Trust Center
Settings => Macro Settings => Disable all macros with notification => OK =>
Save and Close => Reopen Workbook
– When you reopen a file with macros if you get a “Security Warning” do the
following: Options => Enable this content => OK
In Excel 2010 – being done in two stages:
A) Open File => File => Options => Trust Center => Trust Center Settings => Macro Settings =>
Enable all macros … => OK => OK => Save
B) File => Options => Trust Center => Trust Center Settings => Protected View => Disable them
… => OK => OK => Save => Close => Reopen Workbook
Rename First Worksheet:
– Let’s open a new Excel 2007 workbook,
go to the tab bar, double click the tab of the
first sheet and change its name by typing
Shapes_1
Type in Labels and Data:
– Go to the upper left corner of the sheet and type the
following six labels (in column B) and the six numbers
(in column C) just like in the snap shoot to the right
– Next we will create buttons and VBA macros
Bring up the Developer Tab in the Ribbon:
– Go to the MS Office Orb => Excel Options => Popular => Show the
Developer Tab in the Ribbon
Create a Spin Button:
– Developer => Controls => Insert
=> ActiveX Controls => Spin Button
=> Drag draw a button on the sheet
After you drew the button, while the button is still highlighted right click it and
bring up the “Properties” tab. There, you change the name into “Alpha”,
change Min to -1 and Max to 75.
About the Controls Tab:
– Clicking the Design Mode button will bring you in or
out of design mode. After you finish changing the
button properties you will need to get out of design
mode in order to use it.
– Instead of right clicking the button you can also
bring up the properties by clicking the “Properties”
in the Controls tab.
– In 2007 you can bring up the VBA editor by either clicking the “View Code” button or by using
the Alt+F11 shortcut
The first macro (a rotation macro):
– This macro will increase or decrease the value of the Private Sub Alpha_Change()
rotation angle and will also wrap around 0 degrees while
If Alpha > 71 Then Alpha = 0
going down and around 360 degrees while going up.
If Alpha < 0 Then Alpha = 71
– After adjusting the properties double click the button (which
[C2] = 5 * Alpha
brings up the VBA editor) and write the following code.
– After finishing, exit the design mode and test the macro End Sub
An outline of all the buttons:
The following buttons and macros are created using the same procedure.
Here is an outline of the values and code used.
Private Sub Alpha_Change()
If Alpha > 71 Then Alpha = 0
If Alpha < 0 Then Alpha = 71
[C2] = 5 * Alpha.Value
End Sub
Private Sub Beta_Change()
If Beta > 71 Then Beta = 0
If Beta < 0 Then Beta = 71
[C4] = 5 * Beta.Value
End Sub
Private Sub x0_Change()
[C6] = x0.Value
End Sub
Private Sub y0_Change()
[C8] = y0.Value
End Sub
Private Sub Height_Change()
[C10] = Height.Value / 10
End Sub
Private Sub Width_Change()
[C12] = Width.Value / 10
End Sub
Creating the rectangle:
The charted data for the rectangle is contained
in the range B17:C21 (excluding the labels).
Below is an insight on how the data is charted A => B => C => D => A
from width and height. The data is plotted in a
scatter chart. The procedure of plotting the
data is not given here, but you can Google it.
B A
X Y
A Width / 2 Height / 2
B -Width / 2 Height / 2
C D
C -Width / 2 -Height / 2
D Width / 2 -Height / 2
A Width / 2 Height / 2
Next step: Shape Rotation and Shift:
A shape rotation is performed followed by a translation using the formulas to the right.
The result is found in the range D17:E21 (see next page).
Shape Rotation and Shift – excel implementation:
– Range D17:E21 contains the formulas
presented in the previous page:
D17: “=B17*COS(RADIANS(C$2))-C17*SIN(RADIANS(C$2))+C$8”
E17:“=B17*SIN(RADIANS(C$2))+C17*COS(RADIANS(C$2))+C$6
– After filling range D17:E17 with the above formulas copy down D17:E17 to row 21
– Change the chart data from B17:C21 to D17:E21 and you can see the results in the snapshot to the left.
Next Step : a Scene Rotation:
A scene rotation is performed using
x x cos(radians( )) y sin(radians( ))
2 1 1
the formulas to the right. The result
y x sin(radians( )) y cos(radians( ))
2 1 1
is found in the range F17:G21 (see
next page).
Scene Rotation
Scene Rotation – excel implementation:
– Range F17:G21 contains the formulas
presented in the previous page:
F17: “=D17*COS(RADIANS(C$4))-E17*SIN(RADIANS(C$4))”
G17:“=D17*SIN(RADIANS(C$4))+E17*COS(RADIANS(C$4))”
– After filling range F17:G17 with the above
formulas copy down F17:G17 to row 21
– Change the chart data from D17:E21 to
F17:G21 and you can see the results in the
snapshot to the left.
– When you build anything make sure to spend enough time between stages playing
with the model to make sure the model performs as expected.
– Now that everything is finished you can try to see the global effects of buttons
– Even though you might not perceive it in this model, Excel 2007 is much slower
than Excel 2003 or earlier versions. I heard MS might have improved on this in the
2010 version though I have not tried that version yet.
Conclusion:
– Creating basic animation in Excel 2007 was demonstrated
– The interface is awkward, unintuitive and as much as I used it, it looks like a step backwards in
productivity
– Based on what I read on other blogs most of the expert users don’t like it
– The new users are OK with it
– As far as science modeling is concerned, 2007 is a very slow animal, it can be more than an
order of magnitude slower than 2003 and it seems that the charting represents the bottleneck in
speed
Resources:
– There are many good books around. The best author seems to be John Walkenbach from
www.spreadsheetpage.com (unfortunately this page seem to have disappeared)
– People in a rush who are interested in office applications can also watch the beginner series
from: https://www.youtube.com/user/ExcelIsFun . This guy has almost 1000 videos and his
presentations are really nice.
by George Lungu <excelunusual.com>


Peter,
I too would like to look at what you have done. I have looked into the shapes enough to understand your code. I got stuck in rotating collections of shapes that are oriented and rotated relative to each other…. the MS model did not seem to have a rotation matrix definition per object and then one per collection or group.
Thanks, Charles
George great Blog… just found it.
Thanks Charles.
It also seems you understand these operations quite well. I am unfortunately not really interested in formal teaching. I spent a weekend and tried to just to reinvent the perspective formulas. I am interested in applications and also in deriving the formulas “on the beach, on a deserted island” without any formal knowledge. Cheers, George
George. I need to look at more of your examples before offering too much in the way of personal opinion. For the moment if I pick up on the shapes and coding issues.
1. I would not suggest that use of the MS drawing package for rendering complex 3D geometry is a good idea. However, the 2½ D world of extruded shapes can produce remarkably good effects to illustrate ideas. If you wish to see examples then I can send a workbook to you, although the ones that depend upon Excel 2007 functionality may offer little of value for your website.
2. With the coding, you can either stay with the ‘from first principles’ approach or move on to more abstract concepts. The former approach creates problems of ‘not being able to see the wood for the trees’ but, ultimately, in the second approach the basics will become hidden in CAD libraries etc. Hitting the right balance is a challenge.
As for as the balance between VBA and in-sheet calculation is concerned, I rotated a chess board (64 squares linking 81 distinct vertices) with 4 playing pieces using 5 lines of VBA.
With Shapes(“Board”).ThreeD
.RotationX = alpha
.RotationY = beta
.RotationZ = gamma
End With
Alpha, beta and gamma were read from cells on the worksheet after being calculated from the ‘azimuth’ and ‘altitude’ rotations you mention elsewhere.
Peter, for the time being I am sticking with my style since I’ve barely started. Later I might introduce more of other type of coding. Rotation is a rather a secondary issue for me now but I think your suggestion with MMULT is valuable and I will try it in the current post. Once I exhaust this path I might move to a different style. In my very subjective opinion, the first principles are both the forest and the trees for people who are learning. Once somone understands the concept he can move to anything else. I would definitely like to look at those files. Thanks, George
Peter: I’d like to see this workbook to rotate shapes. This could help solve a problem I am currently facing. Regards, Todd
I am enjoying the creativity that has gone into this example as well as others on the site; Excel does not have to be dreary!
There are all sorts of trivial things to be learnt from looking at other’s coding styles; I had not realised that you could use a spinner control without using the linked cell to communicate the value for example. Meanwhile, a couple of ideas for further development:
1. The array formula MMULT gives a mathematically very clear approach to implementing the rotations and translations shown. If combined with named ranges then the formula might read
{=MMULT(coordinates, alpha_rotation) + offset}
The idea could extend to the rotation of 3d boxes rather than sticking with 2d rectangles.
2. The same thing as is done here through the use of scatter charts can also be achieved using drawing objects in the Shapes collection. The advantage then is that fills can be used to create solid blocks of color moving across the worksheet. If you are feeling adventurous these may be extruded into 3d shapes and moved in 3d with fancy shading and lighting effects (Office 2007 and later).
Thanks Peter for the suggestions. I am aware of using shapes to create solid objects. There is a file floating around form a Gamasutra guy. I will use that later for very limited purposes but right now there is enough meat in the wireframe business, plus using VBA extensively to control the vertices defeats the purpose of using excel. I’ve seen objects (faces, cars) created in VBA using the shapes and for fairly small objects the speed even in 2003 was awfully low. In 2007 or 2010 the refresh rate must be less than 1 frame/minute. You can make a cube or a simple object but try putting the coaster in VBA (few thosand vertices) and the loop will have a period of minutes. C and open GL are not that hard so spending time to write VBA for real animation is a waste. Excel has a size threshold beyond which the speed goes down a lot. I am trying to encourage people to work in simple and natural ways, and solve a very wide ranges of problems. In my vision, the physics and occasionally even some math are important. People need to be able to solve any of these problems with a pen and a paper and not worry about syntax or languages. Once you get into more VBA and special functions all of that is lost. One should determine a minimum useful set of funtions and try to stick with that (offset is one of those). Out there in industry and even academia there are many good programmers who one can hire to properly code anything. Yet these people are just good coders. They use “recipes”, modules and libraries and forget to use their mind. In industry companies spend fortunes to buy black box software licenses and the engineers end up being tool jockeys. Creativity, logic and original thinking are generally penalized. I am trying to raise a flag here and give a different example.
Oh yes! Amazing post. I loved this one. I am already practicing and enjoying. Thanks a lot
Try to get an earlier version of Excel too. The models will really come to life.