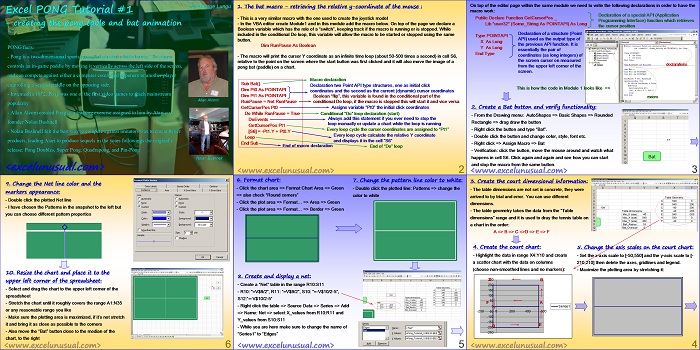
This post contains the first part of a series of tutorials demonstrating how to build a lively game of Pong in Excel.
The section deals with the bat movement VBA macro, and plotting the “court” or “tennis-table” on a 2D scatter chart.
![]()
Excel PONG Tutorial #1 – creating the pong table and bat animation
by George Lungu
PONG facts:
– Pong is a two-dimensional sports game that simulates table tennis. The player
controls an in-game paddle by moving it vertically across the left side of the screen,
and can compete against either a computer controlled opponent or another player
controlling a second paddle on the opposing side.
– Invented in 1972, Pong was one of the first video games to reach mainstream
Allan Alcorn popularity
– Allan Alcorn created Pong as a training exercise assigned to him by Atari co-
founder Nolan Bushnell
– Nolan Bushnell felt the best way to compete against imitators was to create better
products, leading Atari to produce sequels in the years followings the original’s
release: Pong Doubles, Super Pong, Quadrapong, and Pin-Pong
Nolan Bushnell
<excelunusual.com>
1. The bat macro – retrieving the relative y-coordinate of the mouse :
– This is a very similar macro with the one used to create the joystick model
– In the VBA editor, create Module1 and in this module add the macro below. On top of the page we declare a
Boolean variable which has the role of a “switch”, keeping track if the macro is running or is stopped. While
included in the conditional Do loop, this variable will allow the macro to be started or stopped using the same
button.
Dim RunPause As Boolean
– The macro will print the cursor Y coordinate as an infinite time loop (about 50-500 times a second) in cell S6,
relative to the point on the screen where the start button was first clicked and it will also move the image of a
pong bat (paddle) on a chart.
Sub Bat_Tutorial_1() ‘Macro declaration
Dim Pt0 As POINTAPI ‘Declaration two type structures, one as initial click coordinates and the second as the current (dynamic) cursor coordinates
Dim Pt1 As POINTAPI ‘Declaration two type structures, one as initial click coordinates and the second as the current (dynamic) cursor coordinates
RunPause = Not RunPause ‘Boolean “flip”, this variable is found in the conditional part of the conditional Do loop, if the macro is stopped this will start it and vice versa
GetCursorPos Pt0 ‘Assigns variable “Pt0” the initial click coordinates
Do While RunPause = True ‘Conditional “Do” loop declaration (start)
DoEvents ‘Always add this statement if you ever need to stop the the loop manually or update a chart while the loop is running
GetCursorPos Pt1 ‘Every loop cycle the cursor coordinates are assigned to “Pt1”
[S6] = -Pt1.Y + Pt0.Y ‘Every loop cycle calculate the relative Y coordinate and displays it in the cell “S6”
Loop ‘End of “Do” loop
End Sub ‘End of macro declaration End of “Do” loop
<excelunusual.com> 2
On top of the editor page within the same module we need to write the following declarations in order to have the macro work:
Public Declare Function GetCursorPos _Lib “user32” (Some_String As POINTAPI) As Long
Declaration of a special API (Application Programming Interface) function which retrieves the cursor position
Type POINTAPI
X As Long
Y As Long
End Type
Declaration of a structure (Point API) used as the output type of the previous API function. It is essentially the pair of coordinates (as long integers) of the screen cursor on measured from the upper left corner of the screen.
2. Create a Bat button and verify functionality:
– From the Drawing menu: AutoShapes => Basic Shapes => Rounded
Rectangle => drag draw the button
– Right click the button and type “Bat”.
– Double click the button and change color, style, font etc.
– Right click => Assign Macro => Bat_Tutorial_1
– Verification: click the button, move the mouse around and watch what
happens in cell S6. Click again and again and see how you can start
and stop the macro from the same button.
<excelunusual.com> 3
3. Create the court dimensional information:
– The Pong court dimensions are not set in concrete, they
were arrived to by trial and error. You can use different
dimensions.
– The table geometry takes the data from the “Court
dimensions” range and it is used to dray the tennis table on
a chart in the order:
A => B => C =>D => E => F
4. Create the court chart:
-Highlight the data in range X4:Y10 and create a scatter chart with the data on columns (choose non-smoothed lines and no markers):
5. Change the axis scales on the court chart:
-Set the x-axis scale to [-310,310] and the y-axis scale to [-210,210] then delete the axes, gridlines and legend.
-Maximize the plotting area by stretching it:
<excelunusual.com> 4
6. Format chart:
– Click the chart area => Format Chart Area => Green
=> also check “Round corners”
– Click the plot area => Format… => Area => Green
– Click the plot area => Format… => Border => Green
7. Change the pattern line color to white:
– Double click the plotted line: Patterns => change the color to white
8. Create and display a net:
– Create a “Net” table in the range R10:S11
– R10: “=0”, R11: “=0”, S10: “=-V$10/2-5”,
S11:“=V$10/2+5”
– Right click the table => Source Data => Series =>
Add => Name: Net => select X_values from R10:R11
and Y_values from S10:S11
– While you are here make sure to change the name
of “Series1” to “Court”
<excelunusual.com> 5
9. Change the Net line color and the markers appearance:
– Double click the plotted Net line
– I have chosen the Patterns in the snapshot to the left but
you can choose different pattern properties
10. Resize the chart and place it to the upper left corner of the spreadsheet:
– Select and drag the chart to the upper left corner of the
spreadsheet
– Stretch the chart until it roughly covers the range A1:N35
or any reasonable range you like
– Make sure the plotting area is maximized and if it’s not,
stretch it and bring it as close as possible to the corners
– Also move the “Bat” button close to the median of the
chart, to the right
by George Lungu <excelunusual.com> 6


Great stuff. I am a newby at programming and am overwhelmed by what you have accomplished here on your website. I am working on an air traffic control simulator for instructional purposes at work and am hoping to be able to adapt some of your coding techniques to my project. Thank you for making these available to me.