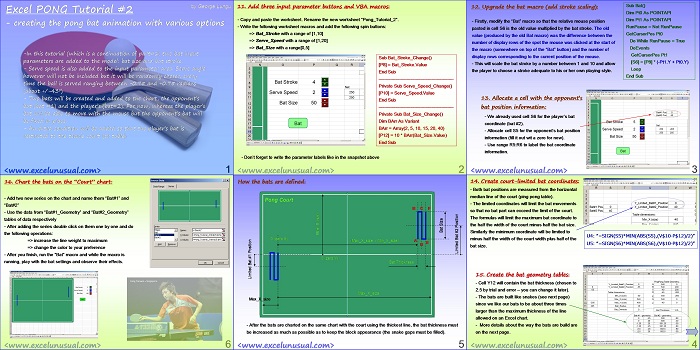
In this section two bats are created (the opponent’s bat and the player’s bat).
The player’s bat movements are controlled by the vertical mouse movement.
The geometry of movement, placement and charting of the bats are explained.
![]()
Excel PONG Tutorial #2 – creating the pong bat animation with various options
by George Lungu
-In this tutorial (which is a continuation of part#1) two bat input
parameters are added to the model: bat size and bat stroke.
– Two bats will be created and added to the chart, the opponent’s
bat (bat #1) and the player’s (bat#2). For now, whereas the player’s
bat will be able to move with the mouse, the opponent’s bat will be
fixed in place.
– While horizontally the bats are fixed, an extra condition will be
added so that the bats are vertically restricted to the tennis court (or
table)
<excelunusual.com> 1
11. Add three input parameter buttons and VBA macros:
– Copy and paste the worksheet. Rename the new worksheet “Pong_Tutorial_2”.
– Write the following worksheet macros and add the following spin buttons:
=> Bat_Stroke with a range of [1,10]
=> Serve_Speed with a range of [1,20]
=> Bat_Size with a range[0,5]
Sub Bat_Stroke_Change()
[P8] = Bat_Stroke.Value
End Sub
————————————————–
Private Sub Serve_Speed_Change()
[P10] = Serve_Speed.Value
End Sub
————————————————–
Private Sub Bat_Size_Change()
Dim BArr As Variant
BArr = Array(2, 5, 10, 15, 20, 40)
[P12] = 10 * BArr(Bat_Size.Value)
End Sub
– Don’t forget to write the parameter labels like in the snapshot above
<excelunusual.com> 2
12. Upgrade the bat macro (add stroke scaling):
– Firstly, copy the “Bat_Tutorial_1” macro and rename the copy “Bat_Tutorial_2”. In the new macro, the relative mouse position pasted in cell S6 is the old value multiplied by the bat stroke.
The old value (produced by the old Bat macro) was the difference between the number of display rows of the spot the mouse was clicked at the start of the macro (somewhere on top of the “Bat” button) and the number of display rows corresponding to the current position of the mouse.
– This will scale the bat stroke by a number between 1 and 10 and allow the player to choose a stroke adequate to his or her own playing style.
Sub Bat_Tutorial_2()
Dim Pt0 As POINTAPI
Dim Pt1 As POINTAPI
RunPause = Not RunPause
GetCursorPos Pt0
Do While RunPause = True
DoEvents
GetCursorPos Pt1
[S6] = [P8] * (-Pt1.Y + Pt0.Y)
Loop
End Sub
13. Allocate a cell with the opponent’s bat position information:
– We already used cell S6 for the player’s bat
coordinate (bat #2).
– Allocate cell S5 for the opponent’s bat position
information (fill it out with a zero for now).
– Use range R5:R6 to label the bat coordinate
information.
<excelunusual.com> 3
14. Create court-limited bat coordinates:
– Both bats’ vertical positions are measured from the horizontal median line of the court (ping pong table).
– The limited coordinate calculations will limit the bat movements so that no bat part can exceed the limit of the court.
The formulas will limit the maximum bat coordinate to the half the width of the court minus half the bat size.
Similarly the minimum bat coordinate will be limited to minus half the width of the court width” plus half of the bat size.
U4: “=SIGN(S5)*MIN(ABS(S5),(V$10-P$12)/2)”
U5: “=SIGN(S6)*MIN(ABS(S6),(V$10-P$12)/2)
15. Create the bat geometry tables:
– Cell Y12 will contain the bat thickness (chosen to 2.5 by trial and error – you can change it later).
– The bats are built like snakes (see next page) since we like our bats to be about three times larger than the maximum thickness of the line allowed on an Excel chart.
– More details about the way the bats are build are on the next page.
<excelunusual.com> 4
How the bats are defined:
– After the bats are charted on the same chart with the court using the thickest line, the bat thickness must
be increased as much as possible as to keep the block appearance (the snake gaps must be filled).
<excelunusual.com> 5
16. Chart the bats on the “Court” chart:
– Add two new series on the chart and name them “Bat#1” and
“Bat#2”
– Use the data from “Bat#1_Geometry” and “Bat#2_Geometry”
tables of data respectively
– After adding the series double click on them one by one and do
the following operations:
=> increase the line weight to maximum
=> change the color to your preference
– After you finish, run the “Bat” macro and while the macro is
running, play with the bat settings and observe their effects.
Feng Tianwei – Singapore
by George Lungu <excelunusual.com>


can someone help with the macros for the spin buttons
They don’t work? It must be the security level. On Mac also none of this works.