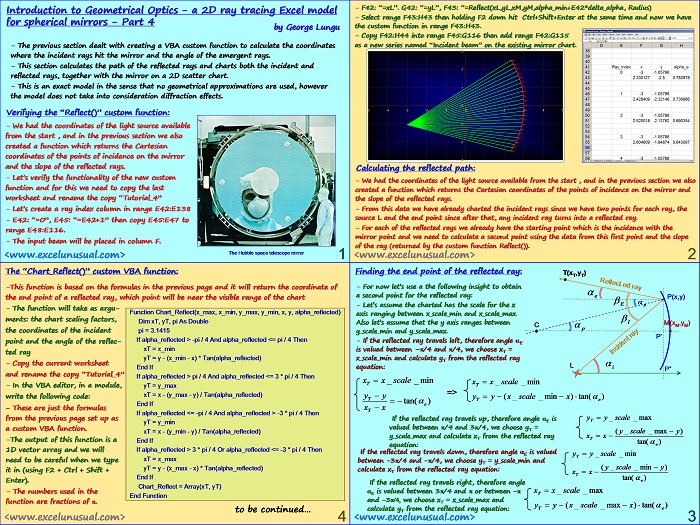
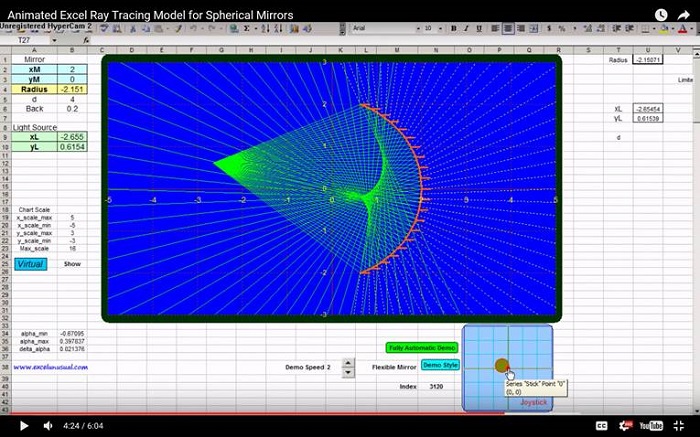
This section begins by charting the incident rays on the same 2D acatter chart with the mirror and then explains how to derive the Cartesian coordinates for a “final” point which together with the point of incidence will define the reflected ray.
A custom VBA function is created for this purpose.
Introduction to Geometrical Optics – a 2D ray tracing Excel model for spherical mirrors – Part 4
by George Lungu
– The previous section dealt with creating a VBA custom function to calculate the coordinates
where the incident rays hit the mirror and the angle of the emergent rays.
– This section charts the incident rays and derives the path of the reflected rays creating a
custom VBA function for calculating an end point for each reflected rays needed to chart them.
– This is an exact model in the sense that no geometrical approximations are used, however the
model does not take into consideration diffraction effects.
Verifying the “Reflect()” custom function:
– We had the coordinates of the light source available
from the start , and in the previous section we also
created a function which returns the Cartesian
coordinates of the points of incidence on the mirror
and the slope of the reflected rays.
– Let’s verify the functionality of the new custom
function and for this we need to copy the last
worksheet and rename the copy “Tutorial_4”
– Let’s create a ray index column in range E42:E138
– E42: “=0”, E45: “=E42+1” then copy E45:E47 to
range E48:E116.
– The input beam will be placed in column F.
The Hubble space telescope mirror
– F42: “=xL”. G42: “=yL”, F43: “=Reflect(xL,yL,xM,yM,alpha_min+E42*delta_alpha, Radius)
– Select range F43:H43 then holding F2 down hit Ctrl+Shift+Enter at the same time and now we have
the custom function in range F43:H43.
– Copy F42:H44 into range F45:G116 then add range F42:G115
as a new series named “Incident beam” on the existing mirror chart.
Calculating the reflected path:
– We had the coordinates of the light source available from the start , and in the previous section we also
created a function which returns the Cartesian coordinates of the points of incidence on the mirror and
the slope of the reflected rays.
– From this data we have already charted the incident rays since we have two points for each ray, the
source L and the end point since after that, any incident ray turns into a reflected ray.
– For each of the reflected rays we already have the starting point which is the incidence with the
mirror point and we need to calculate a second point using the data from this first point and the slope
of the ray (returned by the custom function Reflect()).
Finding the end point of the reflected ray:
– For now let’s use a the following insight to obtain a second point for the reflected ray.
– Let’s assume the charted has the scale for the x E p axis ranging between x_scale_min and x_scale_max.
Also let’s assume that the y axis ranges between I
– If the reflected ray travels left, therefore angle aE
is valued between -p/4 and p/4, we choose xT =
x_scale_min and calculate yT from the reflected ray equation: L i
If the reflected ray travels up, therefore angle aE is T
valued between p/4 and 3p/4, we choose yT = y_scale_max
(y _ scale _ max y)
and calculate xT from the reflected ray equation:
If the reflected ray travels down, therefore angle aE is valued
between -3p/4 and -p/4, we choose yT = y_scale_min and
(y _ scale _ min y)
calculate xT from the reflected ray equation:
If the reflected ray travels right, therefore angle
aE is valued between 3p/4 and p or between -p x x_ scale _ max and -3p/4, we choose xT = x_scale_max and
T from the reflected ray equation:
The “Chart_Reflect()” custom VBA function:
-This function is based on the formulas in the previous page and it will return the coordinate of
the end point of a reflected ray, which point will be near the visible range of the chart
– The function will take as arguments: the chart scaling factors, Dim xT, yT, pi As Double
the coordinates of the incident pi = 3.1415
If alpha_reflected > -pi / 4 And alpha_reflected <= pi / 4 Then
point and the angle of the reflected ray
yT = y – (x_min – x) * Tan(alpha_reflected)
– Copy the current worksheet and rename the copy “Tutorial_4”
If alpha_reflected > pi / 4 And alpha_reflected <= 3 * pi / 4 Then
yT = y_max
– In the VBA editor, in a module, write the following code:
xT = x – (y_max – y) / Tan(alpha_reflected)
End If
– These are just the formulas from the previous page set up as a custom VBA function.
If alpha_reflected <= -pi / 4 And alpha_reflected > -3 * pi / 4 Then
yT = y_min
xT = x – (y_min – y) / Tan(alpha_reflected)
End If
-The output of this function is a 1D vector array and we will need to be careful when we type it in (using F2 + Ctrl + Shift + Enter).
If alpha_reflected > 3 * pi / 4 Or alpha_reflected <= -3 * pi / 4 Then
xT = x_max
yT = y – (x_max – x) * Tan(alpha_reflected)
End If
Chart_Reflect = Array(xT, yT)
– The numbers used in the function are fractions of p.
to be continued…


I apologize Chuck. I updated the link (it was a April-May discrepancy). Thanks for the notice. George
I think you might have a broken link. After clicking on the excel icon for part 4 of the 2d ray traying I get dumped to a page that has nothing on it.