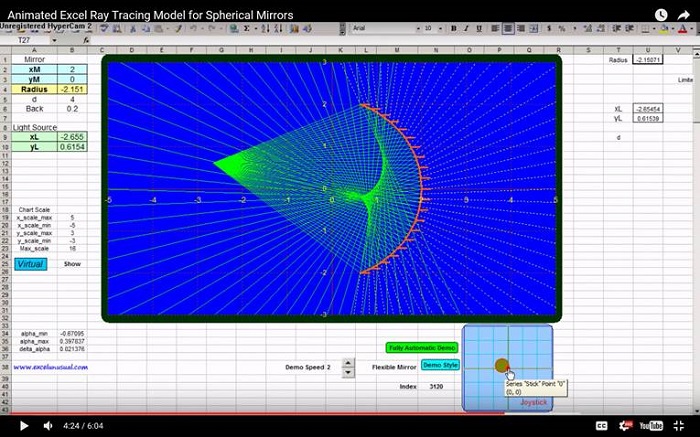
This brief section takes the two previously created custom VBA functions (Reflect() and Chart_Reflect()) and use them to create the data for both the incident and the reflected bundles of rays within the same table.
The data is then plotted on the same chart with the mirror and the result is a preliminary model which you can experiment with.
![]()
Introduction to Geometrical Optics – a 2D ray tracing Excel model for spherical mirrors – Part 5
by George Lungu
– In the previous section we derived the formulas for coordinates of the end point of the
reflected ray (so that it falls not too far away from the visible region of the chart) and we
developed a user defined VBA function, Chart_Reflect(), to calculate the x-y coordinates of that
point.
– This section continues by using both functions (Reflect() and Chart_Reflect()) in the spreadsheet
to define each of the 21 rays in a table and then display them on the same chart with the
mirror.
Using the Chart_Reflect() custom VBA function in the spreadsheet:
– Copy the current worksheet and rename the copy “Tutorial_5”
– Insert the chart maximum scale coordinates:
– Range A18:A22 contains labels and range B19:B22 contains
constants equal to the maximum and minimum values of both x
and y axes.
– For later convenience let’s rename few cells:
=> name B19 “x_scale_max”
=> name B20 “y_scale_min”
=> name B21 “y_scale_max”
=> name B22 “y_scale_min”
Type in the active formulas for both the incident and the reflected rays:
Description:
– The incident and reflected ray formulas will be inserted in
columns E, F, G and H.
– Column E will contain the ray number.
– Columns F and G will contain the x and y coordinates of three
points: the light source, the incidence pint of the mirror (common
to both the incident and the reflected rays) and the terminal point
of the reflected ray.
– Column H will contain the angle of the reflected ray and it will
be used to calculate the terminal point of the reflected ray.
Implementation:
– Range E41:H41 contains labels.
– E42: “=0”, F42: “=x_L”, G42: “=y_L”
– F43: “=Reflect(xL,yL,xM,yM,alpha_min+E42*delta_alpha,Radius)” then select F43:H43 and holding F2 –
down hit Ctrl+Shift+Enter
-F44: “=chart_reflect(x_scale_max,x_scale_min,y_scale_max,y_scale_min,F43,G43,H43)” then select
F44:G44 and holding F2 down hit Ctrl+Shift+Enter
– E46: “=E42+1”
– Copy range F42:H44 into range F46:H48
– Copy range E46:H49 into range E50:H141 and we finished
Plot the incident and the reflected rays:
– Select the chart => Right click the selected chart => Source data => Series => Select the “Incident
Beam” series, rename it “Incident & Reflected Beam” and readjust the series range to F42:G140
– Make sure to double click the plotting area and change the color to a uniform color (not some fill effects
containing a mixture of two colors). Fill effects will slow down the model.
You can further experiment with the model by adjusting not only the mirror diameter and
radius of curvature, but also the distance and angle of the incident beam (a positive radius
of curvature means a convex mirror).
to be continued…


Thanks, Peter for the feedback. Animation is just a lure and the purpose it to give lazy users a chance to see what the model can do. In 2003 my speed is about 40 fps on a mediocre computer. The lens model you sent me looks very nice. Try to work the internals of the lens too. I will probably settle to just plain lens contours for now.
George
I have worked up a refraction model, based upon a minimum time calculation (to help move clear of your current territory of reflection).
I am not convinced animation does it any favours at all though, much too slow. It might be better to provide some interactivity allowing the user to slide optical elements along the bench and then ‘switch on the lamp’ once the ‘experiment’ is set up.
My initial image of the lens is strictly Office 2007 or later, using 3d formats. Since then I have produced a good looking image by using 2d shapes more suited to Office 97-2003. I have yet to try adjusting lens thickness to reflect its radius of curvature.
A concave lens would require a different drawing and the diverging rays would need to be extrapolated back to the virtual image.