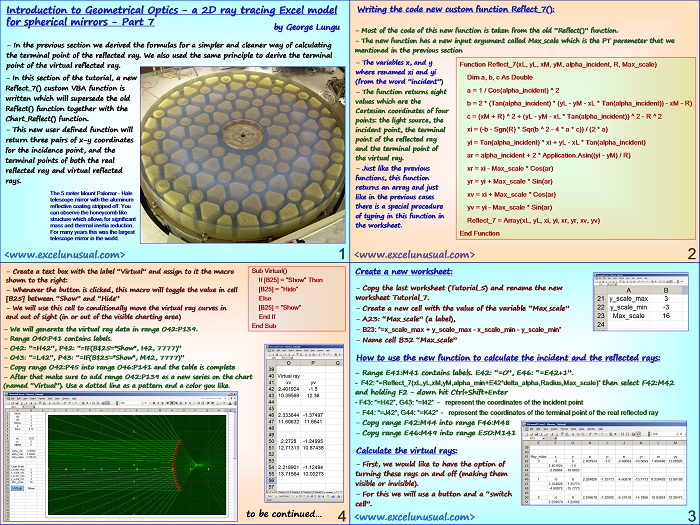
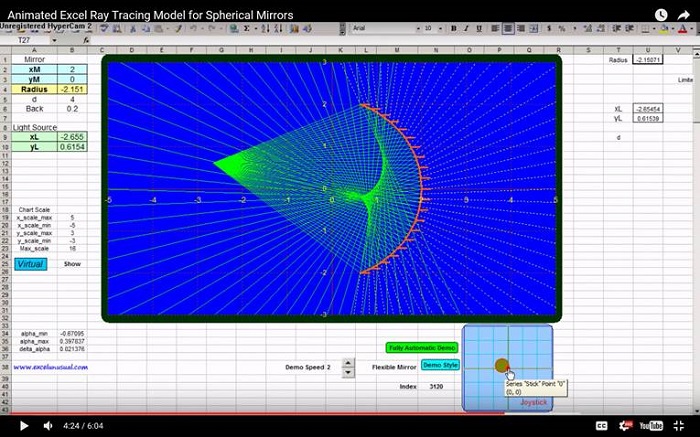
Based on the formulas derived up to this point in the series, this section creates an improved custom VBA function which calculates the x-y Cartesian coordinates of three points: the incident point, the terminal point of the real reflected ray and the terminal point of the virtual reflected ray.
The structure of the function is fairly simple and it is very easy to use too. The model is upgraded using the new function in a new worksheet.
Introduction to Geometrical Optics – a 2D ray tracing Excel model for spherical mirrors – Part 7
by George Lungu
– In the previous section we derived the formulas for a simpler and cleaner way of calculating
the terminal point of the reflected ray. We also used the same principle to derive the terminal
point of the virtual reflected ray.
– In this section of the tutorial, a new
Reflect_7() custom VBA function is
written which will supersede the old
Reflect() function together with the
Chart_Reflect() function.
– This new user defined function will
return three pairs of x-y coordinates
for the incidence point, and the
terminal points of both the real
reflected ray and virtual reflected
rays.
The 5 meter Mount Palomar – Hale
telescope mirror with the aluminum
reflective coating stripped off. You
can observe the honeycomb like
structure which allows for significant
mass and thermal inertia reduction.
For many years this was the largest
telescope mirror in the world.
<excelunusual.com>
1
Writing the code new custom function Reflect_7():
– Most of the code of this new function is taken from the old “Reflect()” function.
– The new function has a new input argument called Max_scale which is the PT parameter that we
mentioned in the previous section
– The variables x, and y Function Reflect_7(xL, yL, xM, yM, alpha_incident, R, Max_scale)
where renamed xi and yi
Dim a, b, c As Double
(from the word ”incident”)
a = 1 / Cos(alpha_incident) ^ 2
– The function returns eight
values which are the
b = 2 * (Tan(alpha_incident) * (yL – yM – xL * Tan(alpha_incident)) – xM – R)
Cartesian coordinates of four points: the light source, the point of the reflected ray and the terminal point of the virtual ray.
c = (xM + R) ^ 2 + (yL – yM – xL * Tan(alpha_incident)) ^ 2 – R ^ 2
xi = (-b – Sgn(R) * Sqr(b ^ 2 – 4 * a * c)) / (2 * a) incident point, the terminal
yi = Tan(alpha_incident) * xi + yL – xL * Tan(alpha_incident)
ar = alpha_incident + 2 * Application.Asin((yi – yM) / R)
– Just like the previous xr = xi – Max_scale * Cos(ar)
yr = yi + Max_scale * Sin(ar)
xv = xi + Max_scale * Cos(ar)
yv = yi – Max_scale * Sin(ar)
Reflect_7 = Array(xL, yL, xi, yi, xr, yr, xv, yv)
End Function
<excelunusual.com>
2
Create a new worksheet:
– Copy the last worksheet (Tutorial_5) and rename the new
worksheet Tutorial_7.
– Create a new cell with the value of the variable “Max_scale”
– A23: “Max_scale” (a label),
– B23: “=x_scale_max + y_scale_max – x_scale_min – y_scale_min”
– Name cell B32 “Max_scale”
How to use the new function to calculate the incident and the reflected rays:
– Range E41:M41 contains labels. E42: “=0”, E46: “=E42+1”.
– F42: “=Reflect_7(xL,yL,xM,yM,alpha_min+E42*delta_alpha,Radius,Max_scale)” then select F42:M42
and holding F2 – down hit Ctrl+Shift+Enter
– F43: “=H42”, G43: “=I42” – represent the coordinates of the incident point
– F44: “=J42”, G44: “=K42” – represent the coordinates of the terminal point of the real reflected ray
– Copy range F42:M44 into range F46:M48
– Copy range E46:M49 into range E50:M141
Calculate the virtual rays:
– First, we would like to have the option of
turning these rays on and off (making them
visible or invisible).
– For this we will use a button and a “switch
cell”.
<excelunusual.com>
3
Sub Virtual()
– Create a text box with the label “Virtual” and assign to it the macro
shown to the right: If [B25] = “Show” Then
– Whenever the button is clicked, this macro will toggle the value in cell [B25] = “Hide”
[B25] between “Show” and “Hide” Else
[B25] = “Show”
– We will use this cell to conditionally move the virtual ray curves in
and out of sight (in or out of the visible charting area) End If
End Sub
– We will generate the virtual ray data in range O42:P139.
– Range O40:P41 contains labels.
– O42: “=H42”, P42: “=IF(B$25=”Show”, I42, 7777)”
– O43: “=L42”, P43: “=IF(B$25=”Show”, M42, 7777)”
– Copy range O42:P45 into range O46:P141 and the table is complete
– After that make sure to add range O42:P139 as a new series on the chart
(named “Virtual”). Use a dotted line as a pattern and a color you like.
to be continued…
<
4


Hello,
very impressive.
can one insert different scatterers defined by algebraic formulas?
any limitations on the numbe rof scatterers?
Interested in in buying this capabilities
Thank you
Tuli,
Anything can be added but the model is not very flexible the way it is.
I have a solution for you. I’ve just sent you an email.