About Excel animation and Excel games – an introduction:
Hello everyone, in this section we will be talking about sprites and and how to use the sprites in MS Excel to create animation. This is going to be a general discussion, a demonstrative, introductory talk. It shows you what we can do with sprites in Excel. In general language, a sprite is a supernatural character like an elf or a fairy.
Video: “Sprite Animation – what are sprites and how to use them in Excel animation”
Usually they are small and they can appear from nowhere, usually living around water, for example in a mythical forest. In gaming animation, a sprite is a 2D computer graphic shape (an image). In 2D games or any type of animation, we can have a character in various positions and if we follow a certain sequence of positions we can have a character perform a certain action (left image below).
In the left half of the picture below you can see a few actions described by groups of sprites, such as crouching, dying, hitting or being hit by something, jumping, walking or running. Similarly, in the right half of the image below, you can also see various actions taken by this character sprite (the little knight).

We can also use sprites in 3D games in Excel animation and Excel games as background images or props, or even characters. These are essentially remote images that are far away from the observer and though, representing a remote 3D object, they are actually 2D images because their structure doesn’t change with small changes in the location of the observer, except of course for translation and resizing. If it’s far away your 3D object will look just like a 2D image.
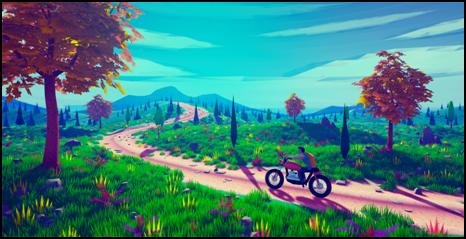
In this landscape above, the trees are probably sprites (2D images) except maybe the few closest trees which need to be 3D objects since even small changes in perspective (position of the observer- or the player) will quickly change the their appearance. The motorcyclist and the road are probably 3D objects, but the mountains and the clouds and the remote trees are certainly 2D sprites. This saves a lot of computer resources during gaming and during the production of the game.
In Excel we can have two options of using sprites for animation or games, one is using sprites as free shapes and the other is using chart bound sprites.
1. Using spites as free shapes in Excel animation
We can use sprites as free pictures, or free shapes that are animated using VBA (Visual Basic for Applications) and this option produces Excel animations that are very flexible and customizable.
Essentially you can import the images, or pictures, or objects created using the draw menu from Excel or PowerPoint. You can then can move them around, rotate them, change the transparency, or change their order, etc. All of this and much more can be done using only VBA without any cell formulas. This option (free sprites animation) might be a little more complicated to implement because you work directly in VBA (Visual Basic for Application programming language). This can also be a little bit messy, because you have a lot of “free” shapes (or pictures) involved, laying around in the spreadsheet.
2. Using sprites bound to a chart while animating in Excel
I started in Excel animation a while ago, using chart bound sprites. I used pictures (or draw objects created using the draw menu) as of data markers (or pasted on data markers) in a 2D scatter chart. Later we will see how to we can do this. Essentially we can create a scatter chart based on a given data, click on markers one by one and paste a picture on each of them.
You can have a large number of markers, hence a multitude of pictures. You can then change the data in real time and have certain markers (sprites) displayed on selected areas of the chart while the other markers are invisible (out of the chart axes range).
The x/y translation of the markers (therefore of the sprites) can be accomplished by changing marker data in an Excel table. Of course a small amount of VBA has to be employed here but it can be kept at a minimum. We can only have an an infinite loop in VBA, which changes an index in a cell within the worksheet. The index value could then be used to update the marker data.
This method (chart bound sprite animation) can easy to implement. It’s a very clean solution at the same time, because al the pictures or objects used (sprites) are encapsulated (contained) within the Excel chart. This method is however not very flexible. You can reposition the points both horizontally and vertically during animation, by changing the chart data using VBA. You can also hide any point during this time by adjusting the marker data to be outside the chart display range (axis range), but you cannot resize the pictures, rotate them, or do any other sprite operation (e.g. change transparency, change shape factor, change sprite order, etc).
Comparison between using sprites as free shapes and using sprites as chart bound pictures in Excel animation
1. Flexibility – free sprites win
Whereas one can scale and rotate free shape sprites using VBA, the chart bound sprites cannot be rotated or re-scaled. There is a tedious work around this. If during the animation process you want to increase or decrease the size of a chart bound sprite, you need to use a set of pre-scaled sprites and bring them in position selectively within the visible range of the chart. Similarly, while one can easily rotate free shape sprites, the chart bound sprites cannot be rotated.
Again, like in the case of scaling, there is a tedious procedure to create rotation effects by using a set of sprites incrementally rotated by a constant increment. Let’s say one can use 35 sprites, each rotated in multiples of 10 degrees to cover 360 degrees. You can then use 35 data points of data and at any time you will only display one marker (sprite) while keeping the rest hidden (outside the chart display range). Of course at any moment, a formula will be used to decide which of the 35 sprites will be displayed.
2. Speed
Excel animation can be quite slow in the new versions of Excel (2007 and newer) but significantly faster in the old versions (1997-2003). In conclusion, both methods of animation (free form and chart based) are fast in the old Excel, but in the new Excel the free form animation seems to be faster than the chart bound sprite animation. In conclusion, despite being more technically difficult, you should use free form sprite animation method if you have a new version of Excel.
3. Simplicity of implementation
Handling chart bound sprites is easy (but the animation is limited). There is no need for much VBA. Also a chart based sprite animation is cleaner option since all the sprites are encapsulated within the chart. From a beginner stand point it’s easier to start with this method.
In a free form sprite solution, one can have tens or even hundreds of sprites scattered in the worksheet, the VBA programming code might get a little large. However, the resulting animation is amazing.
Let’s go and have a look at some examples of Excel sprite animation that are used in Excel games.
Sprite based Excel animation examples
Example #1 – Earth animation from space using chart bound sprites (chart based sprite animation in Excel)
The first example is a chart based Excel animation of the earth from space. I went to a website having published a large collection of photographs of the Earth from space. The satellite might have possibly been a geostationary satellite (which means that it stays in the same position with respect to the Earth by rotating with the same angular velocity as the angular velocity of the Earth). The pictures are therefore taken all from the same location.
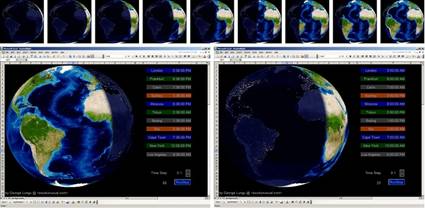
The animation contains 120 pictures of the Earth taken 12 minutes apart by satellites above the equator at 30 degrees longitude west on 10/01/2010. The pictures are 500 x 500 pixels and they are pasted as a background of a chart by a VBA macro.
You can change the speed of the model. The time increment is fixed however at 12 minutes between snapshots. This is a brute force Excel sprite animation and I had to tinker with the macro to make it work without blinks. It is a chart based animation and it’s a very simple one, because at any time there is only one picture displayed and centered in the middle of the chart.
The model runs fairly fast in both versions of Excel and it can be downloaded here.
Example #2 – 3-Body Planetary System with Options (chart based sprite animation combined with wireframe animation in Excel)
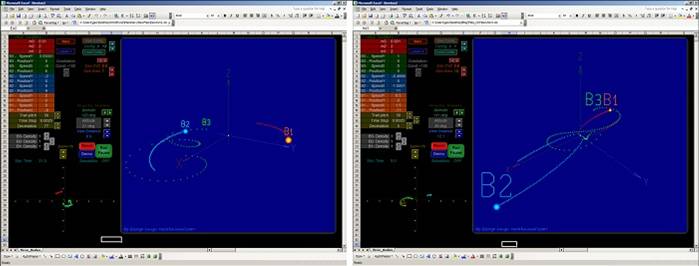
Another model is the following planetary system animation. This again is a 2D-scatter chart based sprite animation. This model is fully dynamically calculated which means that the trajectory of the planets are derived using Newton’s universal attraction formula, plus Newton’s three fundamental laws of motion.
This is a good example of having to use a set of planet sprites of various sizes (each planet has it’s own set of scaled sprites). Depending of the position of each planet only one sprite is displayed at any time. The sprite size is correlated with the position of the planet with respect to the observer.
This means that if the planet is closer to the observer, a larger sprite will be made visible while the rest are hidden (outside of the axes ranges). If the planet is farther, a smaller size sprite is shown. Of course a mathematical formula is used, based on basic geometry, to decide which size sprite is shown at any time.
Example #3 – Flappy Bird Study (free shape sprite animation in Excel)
Another example to prove the use of sprite is the flappy bird animation study. This is a free form sprite style animation (the sprites are not bound to a chart, but could move freely within the spreadsheet). If I start the VBA animation loop, you can see the bird flying up and down and flapping its wings.
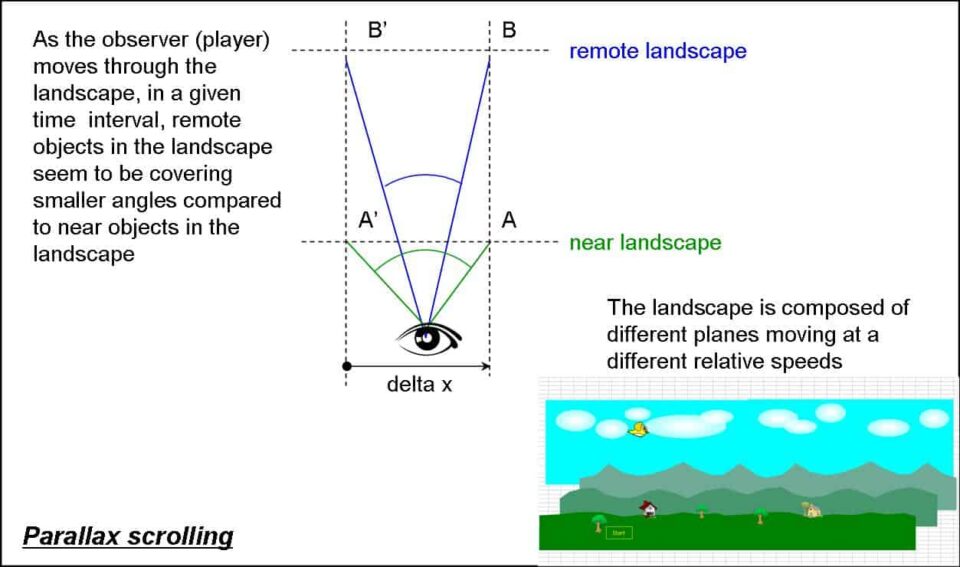
There is also an obvious parallax scrolling effect. Based on Wikipedia, parallax scrolling is a computer graphics technique used in animation where background images move past the camera more slowly than foreground images, creating an illusion of depth, or in other words a sense of 3D effect in a 2D scene.
More about parallax scrolling
While running the animation, you can see the parallax scrolling effect was introduced in both horizontal and vertical direction. It’s similar to riding in a train and looking outside of the window, the near landscape appears to be moving backwards with a speed higher that the remote landscape’s speed. Again this is just an illusion. The near landscape as well as the remote landscape don’t move. The observer moves only. But the apparent angle that a point in the background sweeps in a given time interval (with respect to the observer’s eye) is larger for a close point than the angle a near point sweeps in the same time interval.
Example #4 – Animated electric vehicle (chart based sprite animation in Excel)
Another example to prove the use of sprite animation within a chart for Excel games is the electric car animation. Like all my models, this animation study was built gradually, step by step starting with a very elementary model. It will develop in an Excel game later. I started with the picture of a car (I believe it was a Lamborghini Aventador) that I downloaded from Google images.
The picture was of “.png” type. A .png picture is a picture with clear (transparent) background. In this case the car is opaque but everything around it is clear (clear picture background). Even the windows are semi transparent, which means that once imported in Excel the background behind will embrace the car and it will look all natural.
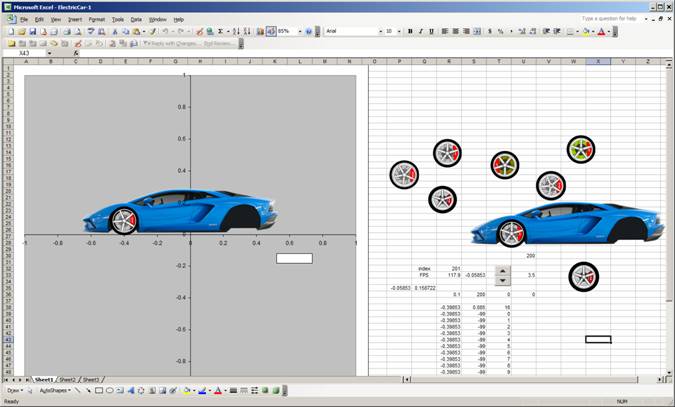
I used a couple of slow varying sinusoidal (sine) functions to slightly move the data marker (hence the car) around the center of the chart both horizontally and vertically.
The wheel sprites
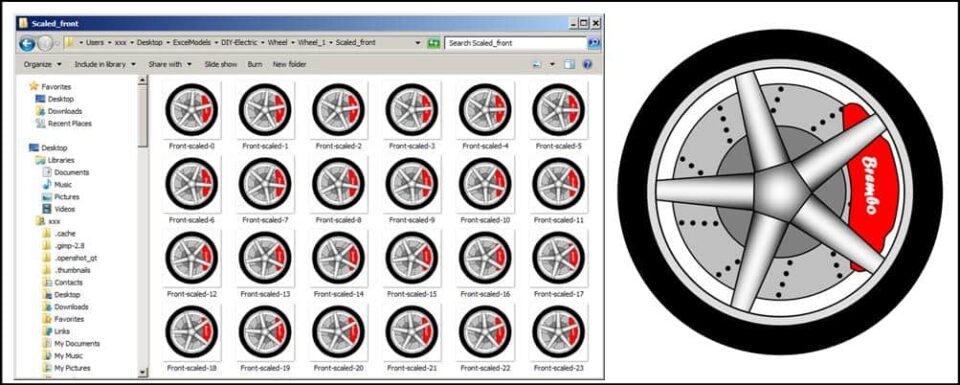
As we talked before, one can neither rotate nor resize a sprite bound to a marker in an Excel chart. Therefore, using the draw menu in PowerPoint, I created 23 wheel sprites.
The sprites represent the wheel rotated in increments of 15 degrees to be able to cover 360 degrees (a full circle). You see 24 wheels in the photo below but the first and the last pictures are the same since a zero degrees rotation is the same as a 360 degrees rotation.
The continuous, endlessly scrolling animated background (landscape)
The car animation model has an infinitely scrolling, continuous background. The continuous scrolling is obtained by using a picture of a city skyline, mirroring it horizontally and using a couple of the new compound pictures (obtained from the original and the mirrored image) added on markers. Choosing the proper marker spacing, the proper chart size and an adequate marker coordinate movement function can generate the infinite loop of scrolling background.
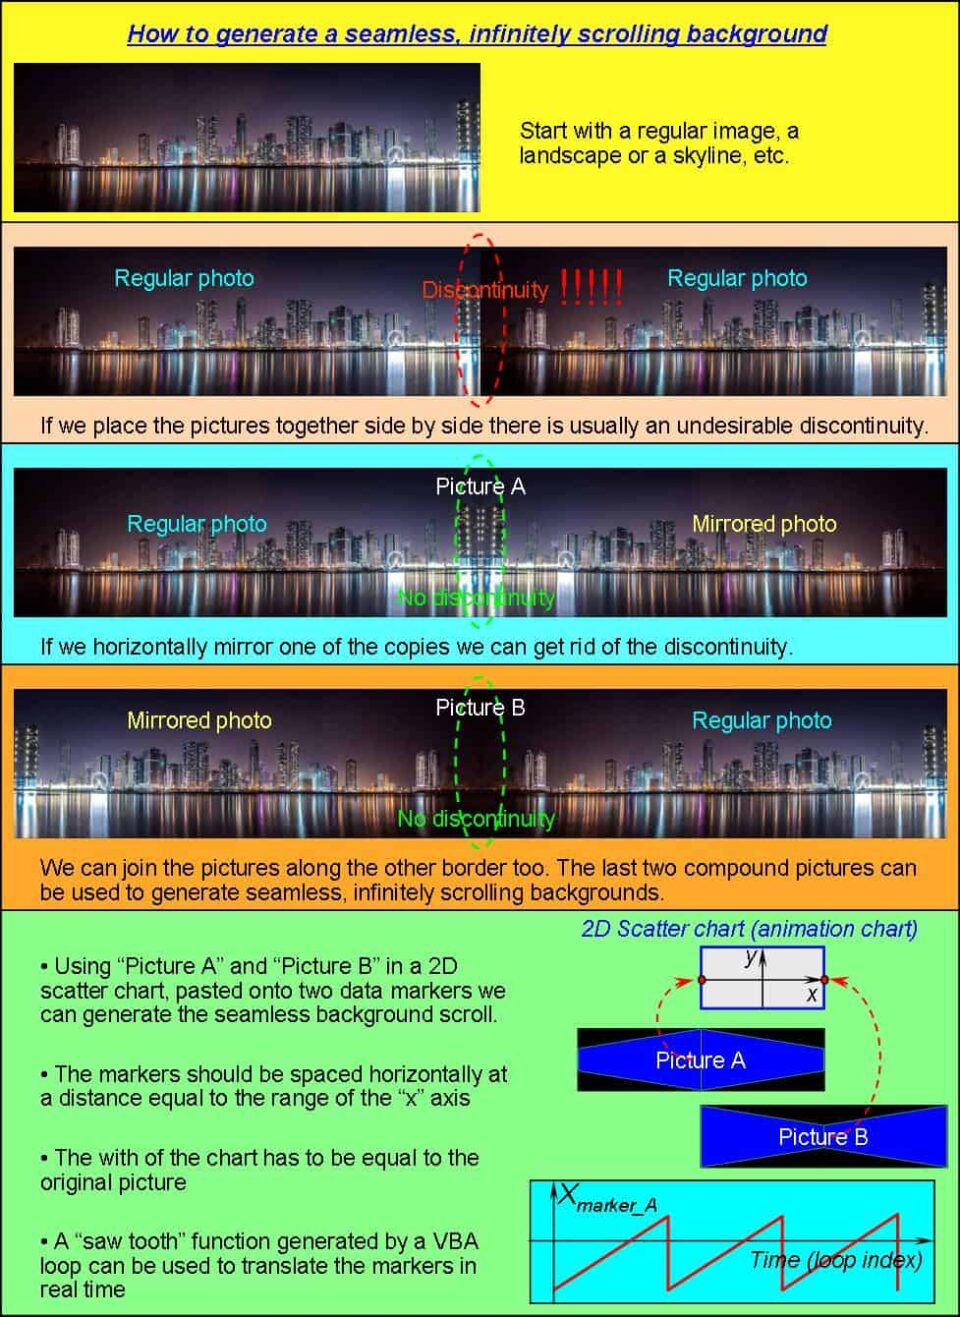
Slide 7 Start with a regular image, a landscape or a skyline, etc. If we place the pictures together side by side there is usually an undesirable discontinuity. If we horizontally mirror one of the copies we can get rid of the discontinuity. We can join the pictures along the other border too. The last two compound pictures can be used to generate seamless, infinitely scrolling backgrounds.
• Using “Picture A” and “Picture B” in a 2D scatter chart, pasted onto two data markers we can generate the seamless background scroll.
• The markers should be spaced horizontally at a distance equal to the range of the “x” axis
• The with of the chart has to be equal to the original picture
• A “saw tooth” function generated by a VBA loop can be used to translate the markers in real time, to generate the animation
Example #5 – a 2D animated internal combustion engine
One of my advanced models is the 2D engine animation created in MS Excel. At the time I am writing this, I already have an even more advanced Excel model having three animated sprite airplane chasing and shooting a fourth UFO plane, but we will talk about that in another post. The engine model is a free form sprite animation.
The model itself has a few hundred parts. There are actually maybe only a total of 20 different parts but most of them have a large number of versions in different colors. Since the model uses free shapes (not bound to a chart), an infinite loop within a VBA subroutine handles the shapes in real time.
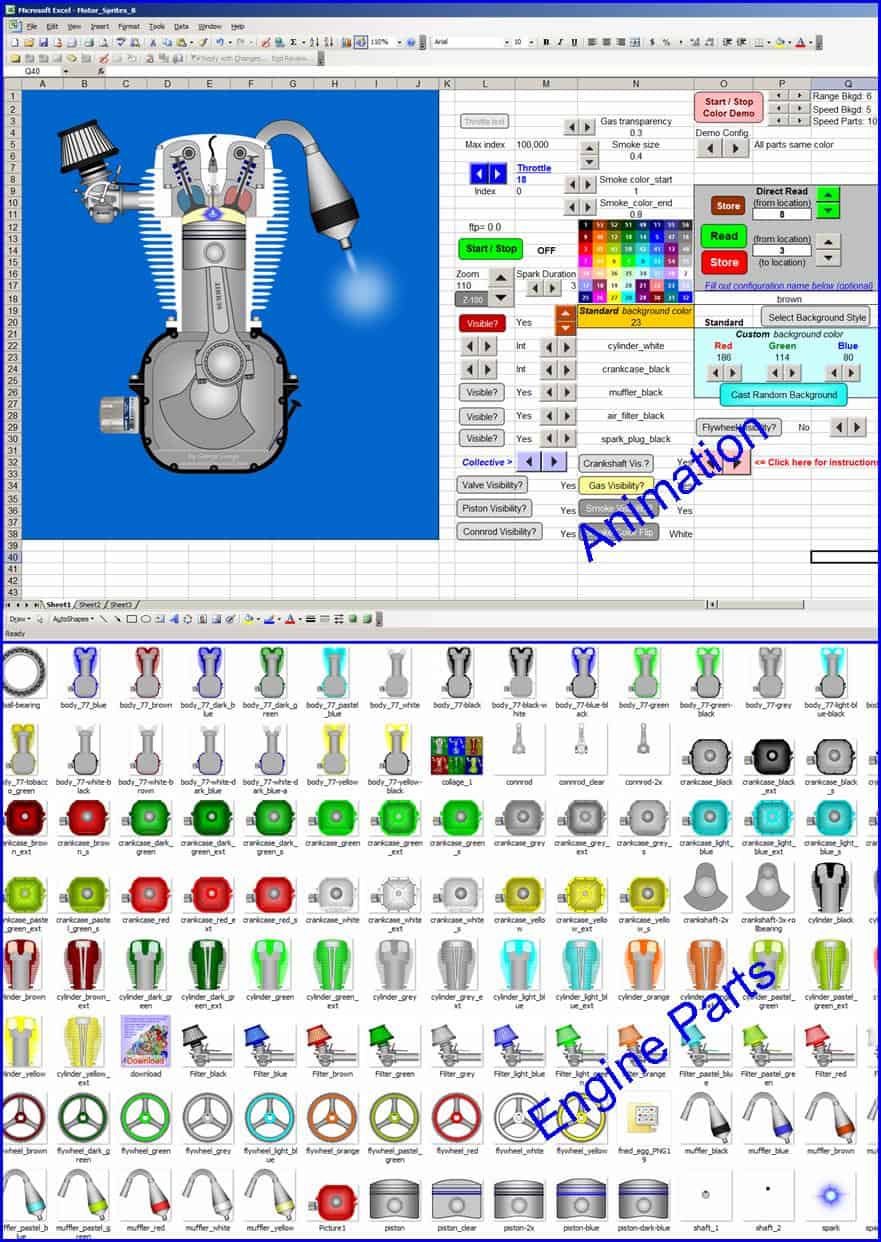
There is a multitude of buttons to select visibility and color options for different engine components. This is a great example of what can be achieved using free form animation. If you have any questions about animation in MS Excel, leave a comment below. Don’t forget to subscribe to my YouTube channel and share this post on social media if you considered it useful.
by George Lungu <excelunusual.com>
Om my goodness!!!!!! This is beyond amazing. I have been a fan of using Excel for “unconventional” things ever since 2003 came out. I like how you are one of the few users out there that knows 2003 is the best version for stuff like this. I am blown away by how you have discovered this type of functionality. It has opened up a whole new world to me. I would love to show you my Powerpoint 2003 tools that I am making that basically use Powerpoint in “unconventional” ways. I was brought here from the roller coaster video in my youTube and this website is easily the best find of the year. Great Great Great job!!!!
Bonjour, SVP envoyer moi le fichier excel VÉHICULE ÉLECTRIQUE ANIMÉ (ANIMATION DE SPRITE BASÉE SUR UN GRAPHIQUE DANS EXCEL)
Merci
I love your work
Thanks Gary and thanks a lot for the link a few years back. I will soon distribute most of my advanced models for free. I am also also coming up with a course soon. I am moving away almost completely from cell formulas since VBA seems to be easier and more elegant to make (though a quite a bit slower).