Hi guys, this is part #1 of a tutorial showing how to generate sprites used in a digital clock model.
Sprites are typically simplified images (usually two-dimensional) which are used to replace complex but remote 3D-objects in an image.
When an object is far away from the viewer a three-dimensional representation is not necessary since the eye cannot see all the details, therefore the object is replaced with a much simple object which will save program and computer resources. In our particular case the reason of using sprites is different.
We use sprites in order to get images which are of better graphical quality than the wire frame objects we normally use on a 2D scatter chart. So… what do you think?
Enjoy, George
![]()

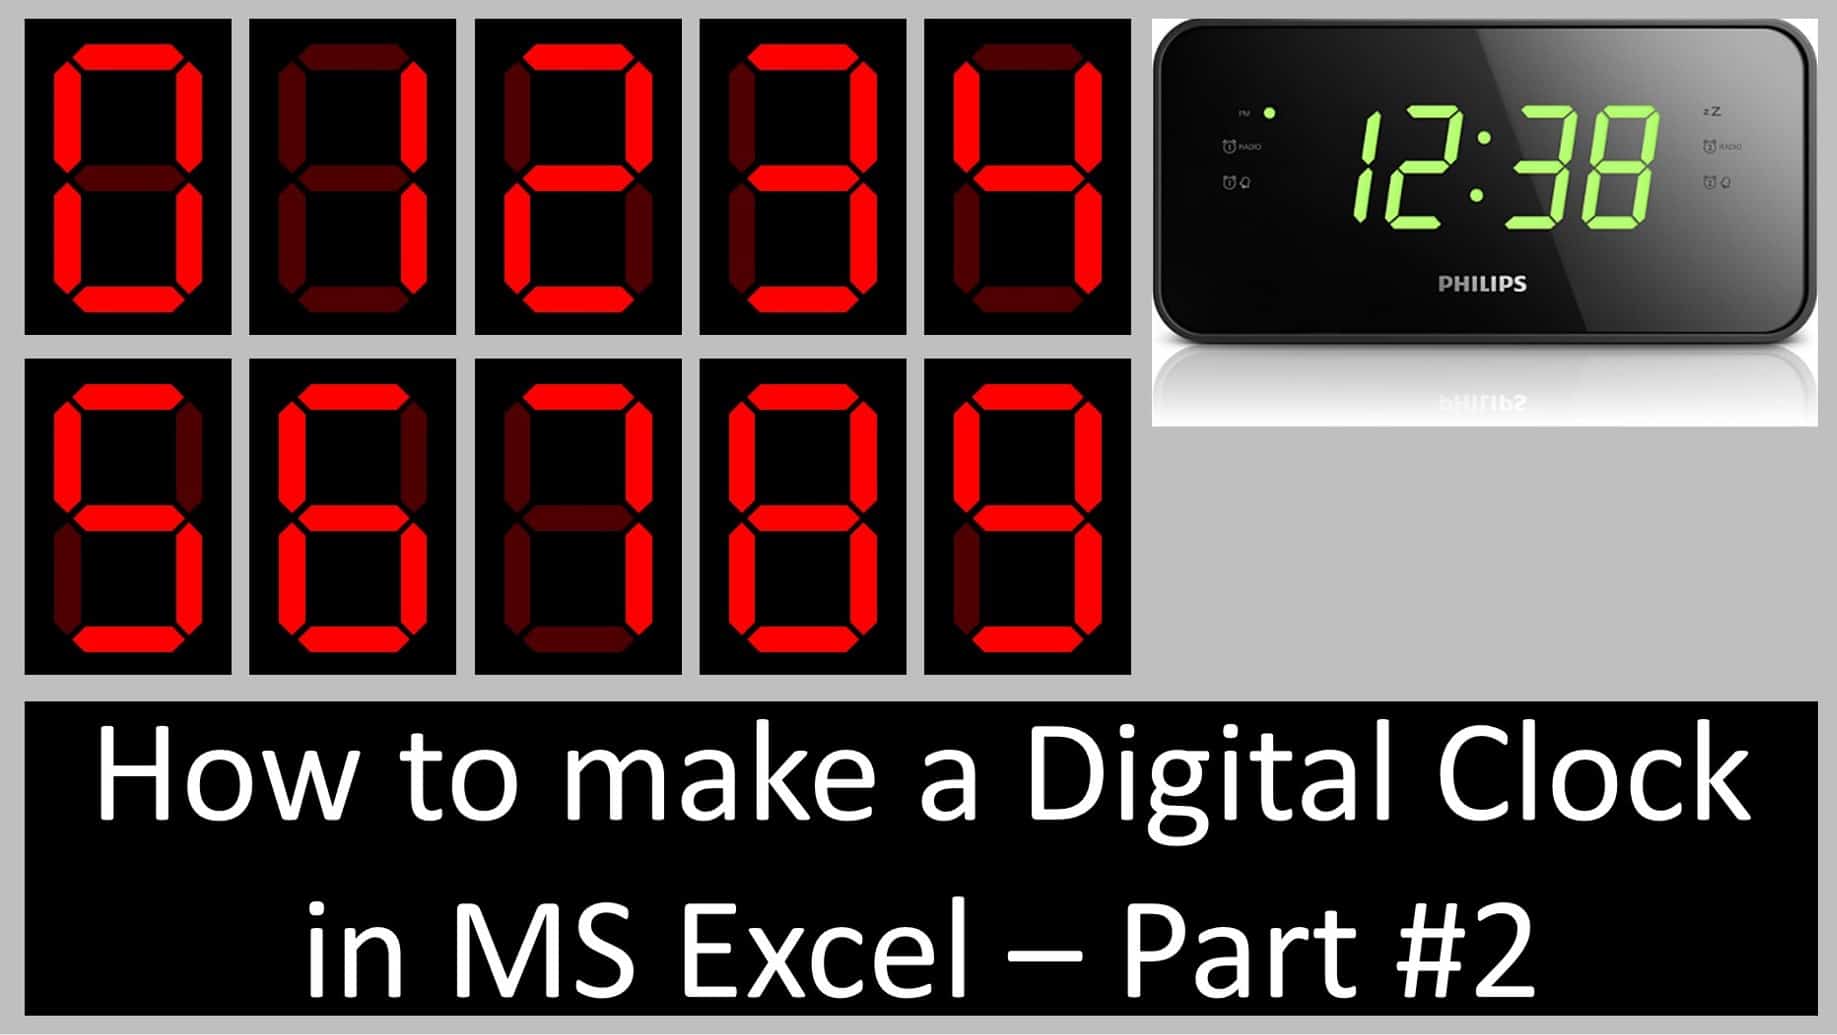
Building an Digital Clock in Excel – part #1 – creating the “digit” sprites
by George Lungu
Sprites:
In computer graphics a sprite is a two-dimensional image or animation that is integrated into a larger scene (Wikipedia). In a 3-dimensional scene representing remote
objects as simple 2D effects results in saving memory and processor power. Since there are just ten different digits (0, 1, 2, 4, 5, 6, 7, 8, 9) we can create ten different images of the digits
and selectively bring into view on a chart just the images of the digits corresponding to the current time.
– There are in total 8 digits on a digital clock face, two for each of the following categories: hours, minutes, seconds.
– To show how the sprites work let’s create the ten sprites and set up a simple macro to bring them into view on a chart, selectively, one at a time in increasing order.
Creating the sprites for the clock digits:
After doing some research around the house I managed to figure out that digit “8” must look something like the this:
Segments
Digit “8”
<excelunusual.com> 1
Make sure you bring up the “Drawing” menu from View ->Toolbars – > Drawing
– Create a vertical rectangle: and copy it:
-Select a rectangle and copy and paste it three times, then rotate them.
– After some rearrangement we get:
Select the vertical rectangles and rotate them around 20 degrees to the right:
<excelunusual.com> 2
– Shorten the horizontal rectangles:
-Group the five shapes, zoom in to max (400%) and add the following twelve short lines:
(here you need to experiment and put some time if you want the finaldigits to look good)
<excelunusual.com> 3
– Change the color of all the lines to blue and group everything together. Now we have a drawing template.
– In the “Draw” menu make sure to uncheck the “Snap-to-grid” option to provide the densest grid.
– Now we are ready to draw the seven segments using the previous lines as a template (AutoShapes -> Line -> Freeform).
– Again increase the zoom and work carefully trying to click on the vertices of the template (we are drawing the segments on the top of the template).
After I draw it, I like to give 50% transparency to the shape so that I can see the template lines underneath for fine tuning.
– You don’t need to start very accurately since after the 6-vertex shape is drawn we can select it, right click it and use the “EditPoints” options to finely adjust the position of the vertices.
<excelunusual.com> 4
– Copy and move the red shape (you could as well crate a new one if you think it’s easier).
– Select it -> Right Click -> Edit Points
<excelunusual.com> 5
– Continue the Copy -> Paste-Move -> EditPoints series of operations:
<excelunusual.com> 6
– Then remove the blue template and add underneath a rectangle slightly larger then the number “8” and roughly centered with
– Finish up the number “8”: the red segments.
<excelunusual.com> 7
– The reason why the rectangle has to be slightly larger than the number “8” is that the sprites have to always have the same dimension regardless of the digit (we get different digits by deleting segments but keeping the rectangle underneath). This way, sprites will be registered (aligned) to one another.
– Slightly move the segments (by using the arrow keys) as to generate small but equal spaces between them (like in a real digital display).
<excelunusual.com> 8
– Make sure to create as even spaces as possible and about the right size. You can study a real digital display for this.
– After this, convert the rectangle in a transparent borderless rectangle (no fill / no line), eliminated the transparency of the segments and slightly adjusted the color to a pale red.
– You can also use a 2 color scheme for the fill in order to model the fringing effects of LED segment illumination (I did this here – as you can see the border of each segment is solid red and the center is a little pale red).
– Remove the border of each segment (double click -> -> line -> color -> no line)
– When you finish “group” everything (all 7
Segments plus the invisible rectangle underneath) !!!
<excelunusual.com> 9
– Now you can resize the grouped shape and copy it 9 times.
<excelunusual.com> 10
– Ungroup EVERYTING and start deleting segments being careful not to move anything.
– After this, group each digit separately (segments plus their underlying rectangle), and we have the sprites ready to be used. Again, be very careful not to move anything as the slightest movement of a single segment will destroy the sprite registration and will result in a jitter of the segment !!!
<excelunusual.com> 11
Conclusions:
– A method for creating sprites was explained.
– For obtaining good quality, registered sprites the following steps must be followed:
1. Generate a template
2. Fill the template with “segment” shapes, then remove the template
3. Add a bottom transparent rectangle and group everything
4. Copy the composite shape as many times as you need
5. Ungroup all, then delete selectively some of the segments
6. Regroup the shapes each to the original “family” of objects (make sure to include the transparent rectangle in the group)
– Next presentation will show how to use the sprites we built in a chart to generate a clock animation.
by George Lungu <excelunusual.com>
Dear Sir/Madam
I am many time try to made 7 segment display but it is not possible to me please give me better idea I am very interested for made that watch I am seen video but not completely undurstand and how to made segment and how to draw.
so please suggest me I am waiting for positive reply by you.
my email. anantpatil46@gmail.com
Thanks And Regards
Anant Patil
Without getting into details I figured out 3 things:
1. The game is a fairly simple sprite type games with easy rules si it can be implemented in Excel in many ways
2. The speed has to be high by using strokes (arrow keys) – that might be a big problem especially in Excel 2007 and 2010
3. There is some trademark on it by some company (this is a small annoyance since the Excel version wouldn’t be commercial)
i found a website with the download from someone who made it maybe you can look how he did it and maybe you can help me then better here is the link:
i want to make a tower defence game in excel does someone knows how to do that plz reply
Let me do some research on that and I will get back to you.
ok thanks!
I wanna learn this it is very interesting