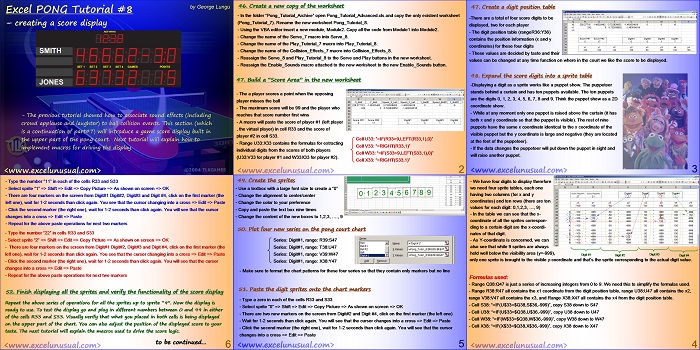
This section explains how to add score board logic on the worksheet and how to display the score on the court chart using sprites.
Excel PONG Tutorial #8 – creating a score display
by George Lungu
– The previous tutorial showed how to associate sound effects (including
crowd applause and laughter) to ball collision events.
This section (which is a continuation of part#7) will introduce a game score display built in
the upper part of the pong court.
Next tutorial will explain how to implement macros for driving the display.
<excelunusual.com>
46. Create a new copy of the worksheet
– In the folder “Pong_Tutorial_Archive” open Pong_Tutorial_Advanced.xls and copy the only existent worksheet
(Pong_Tutorial_7). Rename the new worksheet Pong_Tutorial_8.
– Using the VBA editor insert a new module, Module2. Copy all the code from Module1 into Module2.
– Change the name of the Serve_7 macro into Serve_8.
– Change the name of the Play_Tutorial_7 macro into Play_Tutorial_8.
– Change the name of the Collision_Effects_7 macro into Collision_Effects_8.
– Reassign the Serve_8 and Play_Tutorial_8 to the Serve and Play buttons in the new worksheet.
– Reassign the Enable_Sounds macro attached to the new worksheet to the new Enable_Sounds button.
47a. Build a “Score Area” in the new worksheet
– The a player scores a point when the opposing
player misses the ball
– The maximum score will be 99 and the player who
reaches that score number first wins
– A macro will paste the score of player #1 (left player
, the virtual player) in cell R33 and the score of
player #2 in cell S33.
Cell U33: “=IF(R33>9,LEFT(R33,1),0)”
– Range U33:X33 contains the formulas for extracting
individual digits from the scores of both players
(U33:V33 for player #1 and W33X33 for player #2).
Cell V33: “=RIGHT(R33,1)”
Cell W33: “=IF(S33>9,LEFT(S33,1),0)”
Cell X33: “=RIGHT(S33,1)”
<excelunusual.com> 2
47. Create a digit position table
-There are a total of four score digits to be
displayed, two for each player
– The digit position table (rangeR36:Y36)
contains the position information (x and y
coordinates) for these four digits
– These values are decided by taste and their
values can be changed at any time function on where in the court we like the score to be displayed.
48. Expand the score digits into a sprite table
-Displaying a digit as a sprite works like a puppet show. The puppeteer
stands behind a curtain and has ten puppets available. The ten puppets
are the digits 0, 1, 2, 3, 4, 5, 6, 7, 8 and 9. Think the puppet show as a 2D
coordinate show.
– While at any moment only one puppet is raised above the curtain (it has
both x and y coordinate so that the puppet is visible). The rest of nine
puppets have the same x coordinate identical to the x coordinate of the
visible puppet but the y coordinate is large and negative (they are located
at the feet of the puppeteer).
– If the data changes the puppeteer will put down the puppet in sight and
will raise another puppet.
<excelunusual.com> 3
– We have four digits to display therefore
we need four sprite tables, each one
having two columns (for x and y
coordinates) and ten rows (there are ten
values for each digit: 0,1,2,3, …, 9)
– In the table we can see that the x-
coordinate of all the sprites correspon-
ding to a certain digit are the x-coordi-
nates of that digit.
– As Y-coordinate is concerned, we can
also see that while 9 sprites are always
held well below the visibility area (y=-999), only one sprite is brought to the visible y-coordinate and that’s the sprite corresponding to the actual digit value.
Digit #1 Digit #3
Digit #2 Digit #4
Formulas used:
– Range Q38:Q47 is just a series of increasing integers from 0 to 9. We need this to simplify the formulas used.
– Range R38:R47 all contains the x1 coordinate from the digit position table, range U38:U47 all contains the x2,
range V38:V47 all contains the x3, and Range X38:X47 all contains the x4 from the digit position table.
– Cell S38: “=IF(U$33=$Q38,S$36,-999)”, copy S38 down to S47
– Cell U38: “=IF(U$33=$Q38,U$36,-999)”, copy U38 down to U47
– Cell W38: “=IF(W$33=$Q38,W$36,-999)”, copy W38 down to W47
– Cell X38: “=IF(X$33=$Q38,X$36,-999)”, copy X38 down to X47
<excelunusual.com> 4
49. Create the sprites
– Use a textbox with a large font size to create a “0”
– Change the alignment to center/center
– Change the color to your preference
– Copy and paste the text box nine times
– Change the content of the new boxes to 1,2,3, …., 9
50. Plot four new series on the pong court chart
Series: Digit#1, range: R39:S47
Series: Digit#1, range: T38:U47
Series: Digit#1, range: V39:W47
Series: Digit#1, range: X38:Y47
– Make sure to format the chart patterns for these four series so that they contain only markers but no line
51. Paste the digit sprites onto the chart markers
– Type a zero in each of the cells R33 and S33
– Select sprite “0” => Shift => Edit => Copy Picture => As shown on screen => OK
– There are two new markers on the screen from Digit#2 and Digit #4, click on the first marker (the left one)
– Wait for 1-2 seconds than click again. You will see that the cursor changes into a cross => Edit => Paste
– Click the second marker (the right one), wait for 1-2 seconds than click again. You will see that the cursor
changes into a cross => Edit => Paste
<excelunusual.com> 5
– Type the number “11” in each of the cells R33 and S33
– Select sprite “1” => Shift => Edit => Copy Picture => As shown on screen => OK
– There are four markers on the screen from Digit#1 Digit#2, Digit#3 and Digit #4, click on the first marker (the
left one), wait for 1-2 seconds than click again. You see that the cursor changing into a cross => Edit => Paste
– Click the second marker (the right one), wait for 1-2 seconds than click again. You will see that the cursor
changes into a cross => Edit => Paste
– Repeat for the above paste operations for next two markers
– Type the number “22” in cells R33 and S33
– Select sprite “2” => Shift => Edit => Copy Picture => As shown on screen => OK
– There are four markers on the screen from Digit#1 Digit#2, Digit#3 and Digit #4, click on the first marker (the
left one), wait for 1-2 seconds than click again. You see that the cursor changing into a cross => Edit => Paste
– Click the second marker (the right one), wait for 1-2 seconds than click again. You will see that the cursor
changes into a cross => Edit => Paste
– Repeat for the above paste operations for next two markers
52. Finish displaying all the sprites and verify the functionality of the score display
Repeat the above series of operations for all the sprites up to sprite “9”. Now the display is
ready to use.
To test the display go and plug in different numbers between 0 and 99 in either
of the cells R33 and S33.
Visually verify that what you placed in both cells is being displayed
on the upper part of the chart.
You can also adjust the position of the displayed score to your
taste.
The next tutorial will explain the macros used to drive the score logic.
to be continued…
by George Lungu <excelunusual.com>

