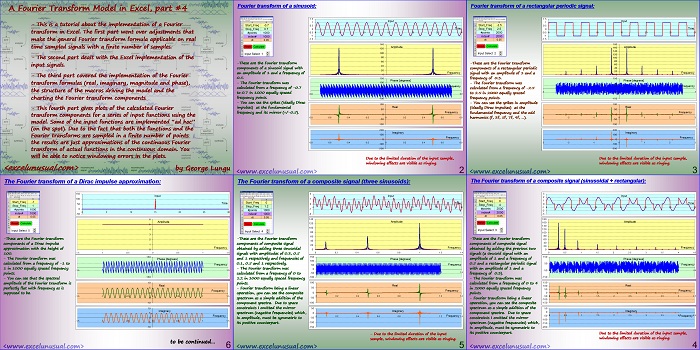
The previous sections explains the creation of a discrete Fourier transform model in Excel.
This section and the following one will use the model to calculate and chart the Fourier transform in several cases of periodic and non-periodic signals.
![]()
A Fourier Transform Model in Excel, part #4
by George Lungu
– This is a tutorial about the implementation of a Fourier
transform in Excel. The first part went over adjustments that
make the general Fourier transform formula applicable on real
time sampled signals with a finite number of samples.
– The second part dealt with the Excel implementation of the
input signals.
– The third part covered the implementation of the Fourier
transform formulas (real, imaginary, magnitude and phase),
the structure of the macros driving the model and the
charting the Fourier transform components
– This fourth part gives plots of the calculated Fourier
transform components for a series of input functions using the
model.
Some of the input functions are implemented “ad hoc”
(on the spot).
Due to the fact that both the functions and the
Fourier transforms are sampled in a finite number of points
the results are just approximations of the continuous Fourier
transform of actual functions in the continuous domain.
You will be able to notice windowing errors in the plots.
<excelunusual.com> by George Lungu
Fourier transform of a sinusoid:
-These are the Fourier transform components of a sinusoid signal with an amplitude of 1 and a frequency of Frequency 0.5.
– The Fourier transform was calculated from a frequency of -0.7 to 0.7 in 1000 equally spaced frequency points.
-0.8 -0.6 -0.4 -0.2 0 0.2 0.4 0.6 0.8
– You can see the spikes (ideally Dirac pulses) at the fundamental frequency and its mirror (+/-0.5).
-0.8 -0.6 -0.4 -0.2 0 0.2 0.4 0.6 0.8
Imaginary
100
Frequency
0
-0.8 -0.6 -0.4 -0.2 0 0.2 0.4 0.6 0.8
Due to the limited duration of the input sample, windowing effects are visible as ringing.
<excelunusual.com> 2
Fourier transform of a rectangular periodic signal:
-These are the Fourier transform components of a rectangular periodic signal with an amplitude of 1 and a frequency of 0.3.
– The Fourier transform was calculated from a frequency of -2.5 to 2.5 in 2000 equally spaced
frequency points.
– You can see the spikes in amplitude (ideally Dirac pulses) at the fundamental frequency and the odd harmonics
(f, 3f, 5f, 7f, 9f, …). -3 -2 -1 0 1 2 3
-50
Imaginary
100
Frequency
0
-3 -2 -1 0 1 2 3
Due to the limited duration of the input sample, windowing effects are visible as ringing.
<excelunusual.com> 3
The Fourier transform of a composite signal (sinusoidal + rectangular):
-These are the Fourier transform 60
components of composite signal 40
20
Frequency
obtained by adding the previous two signals (a sine signal with an amplitude of 1 and a frequency of 0.5 and a rectangular periodic signal with an amplitude of 1 and a frequency of 0.3).
Phase [degrees]
50
Frequency
-50 0 0.5 1 1.5 2 2.5 3 3.5 4 4.5
– The Fourier transform was calculated from a frequency of 0 to 4 in 2000 equally spaced frequency points.
-50 0 0.5 1 1.5 2 2.5 3 3.5 4 4.5
– Fourier transform being a linear operation, you can see the composite spectrum as a simple addition of the component spectra. Due to space constraints I omitted the mirror spectrum (negative frequencies) which, in amplitude, must be symmetric to its positive counterpart.
-50 0 0.5 1 1.5 2 2.5 3 3.5 4 Frequency 4.5
Due to the limited duration of the input sample, windowing effects are visible as ringing.
<excelunusual.com> 4
The Fourier transform of a composite signal (three sine signals):
-These are the Fourier transform components of composite signal obtained by adding three sinusoidal signals with amplitudes of 0.3 and 1 respectively and frequencies respectively.
– The Fourier transform was calculated from a frequency of 0 to -50 in 1000 equally spaced frequency
– Fourier transform being a linear operation, you can see the composite spectrum as a simple addition of the -50
component spectra. Due to space constraints I omitted the mirror spectrum (negative frequencies) which, in amplitude, must be symmetric to -50
its positive counterpart.
– Due to the limited duration of the input sample, windowing effects are visible as ringing.
<excelunusual.com> 5
The Fourier transform of a Dirac impulse approximation:
-These are the Fourier transform components of a Dirac impulse approximation with the height of 100.
– The Fourier transform was calculated from a frequency of -1 to 50 in 1000 equally spaced frequency points.
– You can see that the spectral amplitude of the Fourier transform is 10 perfectly flat with frequency as is supposed to be.
-1.5 -1 -0.5 0 0.5 1 1.5
Imaginary
5
Frequency
-1.5 -1 -0.5 0 0.5 1 1.5
to be continued…
by George Lungu <excelunusual.com> 6


