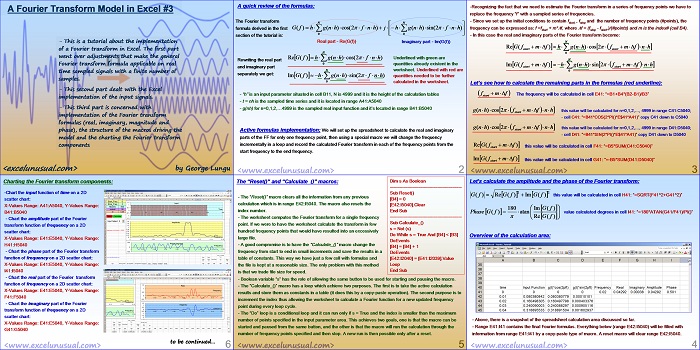
The previous sections of the tutorial handled the basic formulas behind building a Fourier model and creating a set of input functions.
This section deals with formula implementation on the spreadsheet, the brief VBA code and the charting of the Fourier transform components.
![]()
A Fourier Transform Model in Excel #3
by George Lungu
– This is a tutorial about the implementation
of a Fourier transform in Excel. The first part
went over adjustments that make the general
Fourier transform formula applicable on real
time sampled signals with a finite number of
samples.
– This second part dealt with the Excel
implementation of the input signals.
– This third part is concerned with
implementation of the Fourier transform
formulas (real, imaginary, magnitude and
phase), the structure of the macros driving the
model and the charting of the Fourier
transform components
<excelunusual.com> by George Lungu
A quick review of the formulas:
The Fourier transform formula derived in the first section of the tutorial is:
Real part – Re(G(f)) Imaginary part – Im(G(f))
N
Re G(f ) h g(nh)cos(2 f nh)
Underlined with green are quantities already existent in the worksheet. Underlined with red are
quantities needed to be further calculated in the worksheet.
– “h” is an input parameter situated in cell B11, N is 4999 and it is the height of the calculation tables
– t = nh is the sampled time series and it is located in range A41:A5040
– g(nh) for n=0,1,2,…4999 is the sampled real input function and it’s located in range B41:B5040
Implementation of the active formulas :
We will set up the spreadsheet to calculate the real and
imaginary parts of the FF for only one frequency point, then using a special macro we will change the
frequency incrementally in a loop and record the calculated Fourier transform in each of the frequency points
from the start frequency to the end frequency.
<excelunusual.com> 2
-Recognizing the fact that we need to estimate the Fourier transform in a series of frequency points we have to
replace the frequency “f” with a sampled series of frequencies.
– Since we set up the initial conditions to contain fstart, , fstop and the number of frequency points (#points), the
frequency can be expressed as: f =fstart + m*Df, where Df = (fstop – fstart,)/(#points) and m is the index# (cell B4).
– In this case the real and imaginary parts of the Fourier transform become:
Let’s see how to calculate the remaining parts in the formulas (red underline):
The frequency will be calculated in cell E41: “=B1+B4*(B2-B1)/B3”
this value will be calculated for n=0,1,2,…, 4999 in range C41:C5040;
– cell C41: “=B41*COS(2*PI()*E$41*A41)” copy C41 down to C5040
this value will be calculated for n=0,1,2,…, 4999 in range D41:D5040;
– cell D41: “=B41*SIN(2*PI()*E$41*A41)” copy D41 down to D5040
this value will be calculated in cell F41: “=B5*SUM(C41:C5040)”
this value will be calculated in cell G41: “=-B5*SUM(D41:D5040)”
<excelunusual.com> 3
Let’s calculate the amplitude and the phase of the Fourier transform:
this value will be calculated in cell H41: “=SQRT(F41^2+G41^2)”
Phase G( f ) atan value calculated degrees in cell I41: “=180*ATAN(G41/F41)/PI()”
Overview of the calculation area:
– Above, there is a snapshot of the spreadsheet calculation area discussed so far.
– Range E41:I41 contains the final Fourier formulas. Everything below (range E42:I5040) will be filled with
information from range E41:I41 by a copy-paste type of macro. A reset macro will clear range E42:I5040.
<excelunusual.com> 4
The “Reset()” and “Calculate_()” macros: Dim s As Boolean
————————————————
Sub Reset()
– The “Reset()” macro clears all the information from any previous calculation which is in range E42:I5040. The macro also resets the index number.
[B4] = 0
[E42:I5040].Clear
End Sub
– The worksheet computes the Fourier transform for a single frequency points that would have resulted into an excessively index number.
————————————————
Sub Calculate_()
x
s = Not (s)
hundred
Do While s = True And [B4] < [B3]
large file.
DoEvents
[B4] = [B4] + 1
– A good compromise is to have the “Calculate_()” macro change the frequency from start to end in small increments and save the results in a table of constants. This way we have just a few cell with formulas and [E42:I2040] = [E41:I2039].Value
the file is kept at a reasonable size. The only problem with this method is that we trade file size for speed.
– Boolean variable “s” has the role of allowing the same button to be used for starting and pausing the macro.
– The “Calculate_()” macro has a loop which achieve two purposes. The first is to take the active calculation
results and store them as constants in a table (it does this by a copy-paste operation). The second purpose is to
increment the index thus allowing the worksheet to calculate a Fourier function for a new updated frequency
point during every loop cycle.
– The “Do” loop is a conditional loop and it can run only if s = True and the index is smaller than the maximum
number of points specified in the input parameter area. This achieves two goals, one is that the macro can be
started and paused from the same button, and the other is that the macro will run the calculation through the
number of frequency points specified and then stop. A new run is then possible only after a reset.
<excelunusual.com> 5
Charting the Fourier transform components:
-Chart the input function of time on a 2D
scatter chart:
X-Values Range: A41:A5040, Y-Values Range:
B41:B5040
– Chart the amplitude part of the Fourier
transform function of frequency on a 2D
scatter chart:
X-Values Range: E41:E5040, Y-Values Range:
H41:H5040
– Chart the phase part of the Fourier transform
function of frequency on a 2D scatter chart:
X-Values Range: E41:E5040, Y-Values Range:
I41:I5040
– Chart the real part of the Fourier transform
function of frequency on a 2D scatter chart:
X-Values Range: E41:E5040, Y-Values Range:
F41:F5040
– Chart the imaginary part of the Fourier
transform function of frequency on a 2D
scatter chart:
X-Values Range: E41:E5040, Y-Values Range:
G41:G5040
to be continued…
by George Lungu <excelunusual.com> 6


