This section finishes the macro analysis and continues with the conversion of the u-v 2D formula array into a chart-able 1D array.
It also adds two columns to the chart-able array, a masking condition for each triangle and masked u-coordinate which will throw out of the visible portion of the chart any shape which has a minimum of one vertex behind the virtual pilot.
The section also explains the phenomenon of time derivation of the scene due to the action of the control devices (throttle and joystick) and how we can model movement by recursive integration of the scene (using a looped copy-paste operation performed by a macro).
![]()

[sociallocker]![]() [/sociallocker]
[/sociallocker]
A Basic Flight Simulator in Excel #6 – macro review, scene derivation and integration, mapping of the 2D u-v data into a chartable 1D form, chart masking of fallen-behind shapes
by George Lungu
– This section starts by finishing up the explanation of the the new
upgraded Joystick macro which, compared to the old one, has added a
copy-paste operation (from the Present array to the Past array).
– The tutorial then makes a point about why the model of a driven
vehicle (airplane in this case) needs to have copy-paste operations
executed every time step in a loop. It is all about needing to integrate
landscape data because the vehicle derivates its coordinates (linear and
angular) due to the nature of its controls (joystick or throttle).
– Finally the section explains the implementation of the u-v scene
data from a 2D into a chartable 1D data table with its masking
condition column and the masked u-coordinate column.
Finish up the JoyStick macro:
– Copy the “Tutorial_5” worksheet and rename the new worksheet “Tutorial_6”
– The new JoyStick macro, shown below, is a slightly upgraded version of the old JoyStick macro.
– The old macro printed the cursor coordinates as an infinite time loop (about 50-500 times a second) in cell B50
and C50 respectively, relative to the point on the screen where the start button was first clicked and also moved
the image of a joystick on a chart. The new macro adds a paste range line and two more DoEvents lines.
Macro Declaration
Declaration two Point API type structures, one as initial click
coordinates and the second as the current (dynamic) cursor
Sub JoyStick()
coordinates
Dim Pt0 As POINTAPI
Dim Pt1 As POINTAPI
This flips the “RunPause” Boolean variable and allows the macro to
be started and paused clicking the same button (chart)
RunPause = Not RunPause
Assigns “Pt0” the initial click coordinates
GetCursorPos Pt0
Conditional “Do” loop declaration (start)
Do While RunPause = True
DoEvents Always add this statement if you ever need to stop the loop
GetCursorPos Pt1 manually or update a chart while the loop is running
DoEvents
Every loop cycle assigns “Pt1” the cursor coordinates
[B50] = Pt1.X – Pt0.X
DoEvents Every loop cycle calculate the relative coordinates
and display them in the range “B50:C50”
[C50] = -Pt1.Y + Pt0.Y
DoEvents This line is new and it practically copies the values of Present array
[V401:BT523] = [V271:BT393].Value into the Past arrays as constants to be used by the Present array as
Loop arguments to evaluate its formulas during the next time step.
End Sub
End of “Do” loop declaration
End of macro declaration
<excelunusual.com>
2
A rant and an insight into derivative controls and integrating scene retrieval:
– Once I opened an electronic sample of an animation book on Google written by an academic, and I was surprised to
find functions like cosine(arctangent(x)), which is not a very wise formula to use.
That function might work using extra auxiliary conditions (arctangent is not bijective). I used that type of math at the beginning, some years back while
building my first planetary model and I learned the hard way to use my own reasoning before regurgitating formulas. I
also learned that the whole angle retrieval can almost always be done neatly and elegantly by triangle similarity. The
formulas are far simpler the latter way.
– What I learn, I try to discover by experimentation since I realized that learning this way is far more productive, and
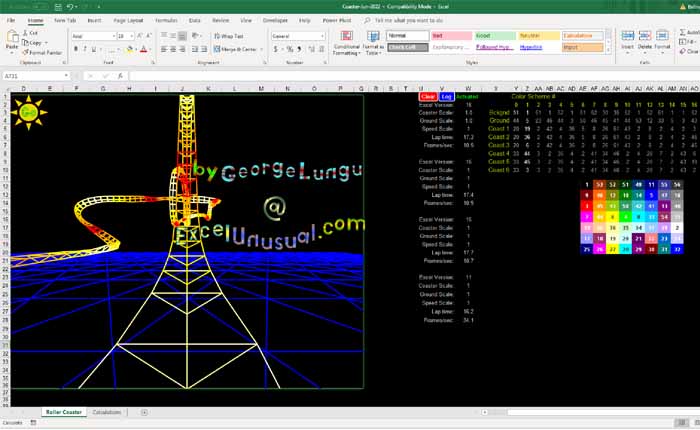
lasting than the school-based or book-based learning . After making and rotating simple shapes I made the roller
coaster.
I realized then that the simplest way to run trough a scene or create the coaster from a parametric table is by
copying the scene transformation results into a “past” buffer, and using the data in the “past” buffer together with some
control parameters to calculate the further transformations.
– I wondered at that time why we needed to copy and paste data and not just figure out the angle by geometrical
manipulation.
-The answer to that is that while driving or flying, the throttle or control stick are derivative devices since they control an
acceleration (in case of a rocket a double time derivative), a speed or rate of turn (rate of turn = angle derivative with
respect to time).
To calculate the value of distances or angles one needs to integrate. We can integrate recursively by
adding a “current increment” to the past value of the integral itself which past value of an the integral is itself the
accumulation of other previously past values.
– Unlike controlling a crane arm where the arm position is proportional to the position of a joystick, in the case of a
plane, the control stick will perform a time derivative of the angle of roll for instance by controlling not the angle but an
angle’s rate of change in time.
We need to step-by-step integrate the scene parameters in time while using these types
of controls in order to calculate its absolute position with respect to the airplane at any time.
<excelunusual.com>
3
Macro functionality review:
– The Reset macro copies a fixed landscape into the Past buffer array. What we are going to plot is an
image using the vertices in the Past array because after reset the data is a straight version of the
original image (before the first time step – no turns of shifts). The Present array contains the landscape
coordinates rotated a little already (after time step).
– Besides updating the player controlled rates of pitch and roll, the Joystick macro will repeatedly
perform the following cycle: it will paste the updated calculation results into the Past array where the
worksheet will use these values as a staring point to calculate the new results (pitch + roll + y-translation).
The new results will then replace the old results in the Past array with the help of the joystick macro. We are performing integration on the scene.
– Why do we need to perform integration? Because the joystick is a device which perform a derivative effect on the image (the larger joystick displacement the larger the image rate of turn – da/dt).
Introduction to the chart data table:
– We need to chart the triangles as a unique curve on a 2D
scatter chart and for this, we need to list all the vertices
(more then once) in the right order with spaces between
triangles. An example for one triangle would be
A more detailed table for two scene
columns is shown on the left side of this page. The two tables (red and green) shown are actually part B 00 01 02
of the same 2 column wide and 5 x 40 x 40 = 8000 row tall table created using all the vertices from the array.
The u-v array has 3 x 41 x 41 vertices and we need to be very careful how we map the u-v table
into the chart data table. The u-v table has a vertical periodicity of 3 and in columns 0, 3, 6, … it has data
for u, in columns 1, 4, 7, … it has data for v and in columns 2, 5, 8, … it has data for ES+SO+y which is
a “masking” variable used to send a shape having at least one vertex behind the observer out of view in
order to prevent annoying artifacts from showing up in the image.
4
Be aware that by the way the file is written at this point, in the Landscape, Present, Past, u-v (and soon in Chart
Data) arrays, the y scene coordinate increases down the column (going down vertically). In the multi-triangle
diagram from the previous page there is a discrepancy in the sense that the y scene coordinate is facing up
(towards the top of the page). There is nothing wrong, just keep that in mind while building the Chart Data array.
How to implement the chart data table:
– Since the u-v is a 123 x 41 size array and the chart data table is a 8000 x 2 size array, in order to map the u-v matrix
(array) into the chart data table, a convenient option would be to use the OFFSET() function.
– All the data from the chart data table will be absolutely referenced to the upper left corner of the u-v matrix.
– The positioning across the u-v matrix of the data mapped in the chart data table will be controlled by two indices
(column and row) within the offset function.
– We will add a column to the chart data table where we store the offset indices that
will adequately vary along the chart data table so that they retrieve the proper triangle
data from the u-v table.
– A81, A86, A91, A96,…… A8076 will contain column indices
– A82, A87, A92, A97,…… A8077 will contain row indices
– A81: “=0”, A82: “=0”, B81: “=OFFSET($V$531,A82,A81)”
– C81: “=OFFSET($V$532,A82,A81)”, B82: “=OFFSET($V$531,A82,A81+1)”,
– C82: “=OFFSET($V$532,A82,A81+1)“, B83: “=OFFSET($V$531,A82+3,A81)“
– C83: “=OFFSET($V$532,A82+3,A81)“, B84: “B81”, C84: “C81”
– A86: “=A81”, A87: “=A82+3”
– Copy B81:C84 into B86:C89 then copy A86:A90 into A91:C100
– Copy B81:C90 into B91:C100 then copy A91:C100 into A101:C280
– Copy A81:C280 into A281:C480 then change A281: “=A81+1”
– Copy A281:C480 into A481:C8080 and you completed the u-v section of the Chart Data Table
<excelunusual.com>
5
Upgrade the chart data table: add the masking condition and the masked u-coordinate:
– We know that if any of the vertices of a shape falls behind the eye of the observer (point E) we are going to observe
annoying visual artifacts.
– For each vertex, we already have a function calculated in the u-v table that verifies for that condition and returns a 0 if
the vertex is behind the observer and a 1 if the vertex is in front of the observer.
– For each of the 40 x 40 = 1600 triangles we will check for that condition on all three corners (vertices) and hide the
triangle by increasing the y coordinates to very large numbers if that condition is true for at least one vertex.
– The masking condition will be included in column D (range D81:D8080) and the masked v-coordinate will be included
in column E (range E81:E8080). In the end we will plot v_masked(u) and the plot will be artifact free.
D81: “=OFFSET($V$533,A82,A81)*OFFSET($V$533,A82,A81+1)*OFFSET($V$533,A82+3,A81)”
=> D86: “=OFFSET($V$533,A87,A86)*OFFSET($V$533,A87,A86+1)*OFFSET($V$533,A87+3,A86+1)”
=> D82: “=D81” then copy D82 down to D84
=> E81: “=IF(D81,C81,777)” then copy E81 down to E84
=> D87: “=D86” then copy D87 down to D89
=> E86: “=IF(D86,C86,777)” then copy E86 down to E89
=> Copy D81:E90 down to D91:E8080
Using the offsets below plot B81:B8080 as x and range E81:E8080 as y on
a 2D scatter chart with the scale [-20,20] for the x axis and [-5,5] for the y-axis:
<excelunusual.com> to be continued…
6
I also think traking the zenith (your sun image) and cardinal points of the compass relative to the aircraft axes is worthwhile. The increment dy should be omitted for these updates. You will need this for the compass (VOR beacons could be good) etc.
Mind you if you track zenith, North and East you will have the large rotation matrix linking the ground axes to aircraft axes. You could bypass the incremental update of the ground vertices and obtain them directly from the fixed set.
I almost did that few days ago when I put the sun in, I realized that putting labels there it won’t be good since they would be upright all the time. I decided to synthesize the cardinal points (including zenith and nadir later with Excel chart curve so that when you roll the plane they faithfully follow in rotation. The change in color of the landscape (green upright, maybe red upside down) was in the store from the beginning but I still have to implement the altitude function first (I don’t have that yet so I cannot do that). If you check the coaster I have something similar (three sets of points with three colors). They will all come together but I need to stick with the tutorials first.
Hi George. You mentioned that the ground mesh updates faster if you omit the pretty markers. How about accepting the more rapid rendering that is achieved with lines only but then add another data series with judiciously placed markers; three or four lit highways or a set of runway approach lights say.
That wold be a huge gain in speed. For now I am not worried about markers, but I will implement the large lines (anchored at the ends only later. I will soon add relief (uneven) and that is possible only with tiling. However later I will make a fast training version for 2007-2010 with no-vertex squares.