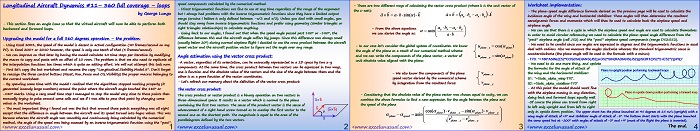
This is a continuation of the PLL series of tutorials and it starts by implementing and testing the low pass filter created in the previous section.
After that, the block diagram is updated and the presentation begins to show how to build the PLL model in a worksheet using the existing LPF formulas.
![]()

[sociallocker]![]() [/sociallocker]
[/sociallocker]
How to Model a Phase-Locked Loop (PLL) in Excel – part #2
by George Lungu
-This is the continuation of part #1 of the
PLL tutorial. The first part described the
block diagram and derived the numerical
equation used in modeling the low pass
filter.
– Before implementing the PLL it is good
to model the low pass filter (LPF) as a
stand alone component.
– We do this since the LPF is the most
complex part of the system and it is a very
good practice in practical electronics and
in engineering in general, to test all the
blocks and subsystems individually before
putting them together into a large system.
– The last part begins the implementation
of the full model in the worksheet.
Out
Noise
<excelunusual.com>
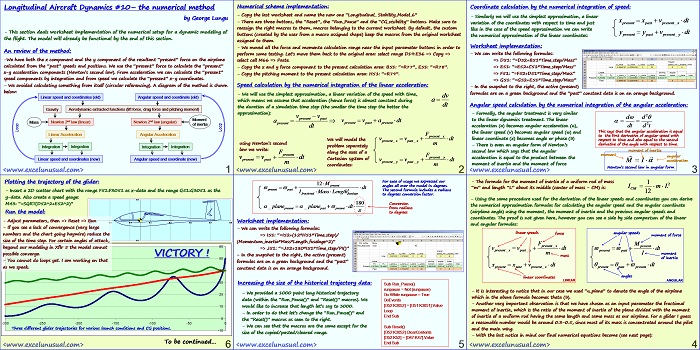
Verifying the functionality of the low pass filter:
– Open a new workbook and call it “PLL_Tutorial”.
– Select the tab of worksheet “Sheet1” and rename it LPF
– Create the labels as indicated in the snapshot to the right in
cells B3, B5, B5 and range B11:E11
– Pad the range B13:E13 with zeros and give the input
parameters the values from the picture
– Create the time series T14: “=B13+C$5” and copy down to cell B300
– Create the rectangular input wave oscillating between -1 and 1 with a frequency from cell C7 (1Hz)
C14: “=SIGN(SIN(2*PI()*C$7*B14))”
-Using the two formulas based on the backward and forward derivative approximations from in the previous
section of the tutorial, create the output series in columns D and E:
h-u (n)*R*C*u (n+1)
in out
D14: “=(C$5*C14+C$3*D13)/(C$3+C$5)” u (n)
out
E14: “=E13+C$5/C$3*(C13-E13)” h
– Copy B14:E14 down to B300:E300
– Plot the following three curves on the same chart against the time series: u_in, u_out_B and u_out_F
<excelunusual.com> 2
u_out_backward u_out_backward u_out_backward
– The above curves correspond to RC values of 0.03 sec., 0.1 sec. and 0.3 sec.
– The responses look just right for a low pass filter and the difference between the backward and forward
approximations are small (you can verify that the difference drops with the time step size).
Let’s redraw the PLL block diagram:
-We added a gain stage (VVCO) for the control voltage in the voltage control oscillator (VCO). This is an important parameter since it controls the range of output frequency of the VCO
uPD(t) Low uLPF(t)
Phase
uin(t)
Pass
Detector
Filter
-The output uout(t)and input uin(t)voltages are the inputs to the phase detector block
-The phase detector block outputs a voltage called uPD(t)into the filter and the filter outputs a voltage called uPD(t)into the VCO
uout(t)
<excelunusual.com> 3
Some issues with modeling frequency modulation
– You could read about anything and learn something but if you really want to learn try it yourself and
make your own mistakes.
If you go to a movie or read a novel, I bet you wouldn’t like someone to tell you
beforehand how it ends. I believe that the current educational system promotes lack of confidence. You
are always told to study more, get “better”, gain “experience”, gain “skills”, read books, read research
papers, ask the “experts”, get a higher degree, get a Ph.D., get an MBA, work in groups.
People live with the wrong impression that they are lacking the internal power to do much because they were conditioned
this way by the system. Just like being healthy erodes the profits of the “health system” as an institution,
using your mind is empowering you but it diminishes the importance of the educational system.
The vast majority of times all you need to do is just close the door, sit down and think. It could save you weeks,
months, or even years of beating around the bushes to solve ONE problem.
-Some time back I was attempting to model a frequency modulated wave for a PLL (the VCO) using two columns,
a time series and of course the sinus function. Seemed straightforward, even trivial. At first I couldn’t figure out
why the result was not at all what I expected.
-After some struggle and digging I realized that it was important to replace the time column with a phase column
calculated iteratively. More on this topic will be covered in a later presentation.
What would the two worksheet tables contain?
Input parameters:
Calculated values:
-Input frequency-Input Low
-Input phase uPD(t) uLPF(t)
Phase
uin(t)
frequency step size Pass
-uin(t)
Detector
Filter
-VCO free oscillation
-uPD(t)
frequency
-uLPF(t)
-RC for the LPF
-Output phase Voltage
-KVCO-conversion gain Controlled Kvco
-uout(t)
Oscillator
-Time step size
uout(t)
<excelunusual.com> 4
Spreadsheet implementation:
-Rename the second worksheet “PLL_a”.
-There are four labels in the upper area (input parameters area).
-There are six labels in the bottom area (calculation area).
-You can use the same names or make your own.
-Create four buttons: =>“Fin” with a range of [-50, 50]=>“Delta_Fin” with a range of [1, 20]=>“K_vco” with a range of [0, 13]=>“RC” with a range of [0, 6]
-The macros associated with these buttons are:
Private Sub Delta_Fin_Change()
[B9] = Delta_Fin.Value / 20
End Sub
Private Sub Fin_Change()
[B11] = [B3] + [B9] * Fin.Value
End Sub
Private Sub K_vco_Change()
ArrVCO = Array(-10, -5, -2, -1, -0.5, -0.2, -0.1, 0.1, 0.2, 0.5, 1, 2, 5, 10)
[B7] = ArrVCO(K_vco.Value)
End Sub
Private Sub RC_Change()
ArrRC = Array(0.1, 0.2, 0.5, 1, 2, 5, 10)
[B5] = ArrRC(RC.Value)
End Sub
-The last two macros use arrays to create a lookup table type of variation, the kind you can find in an oscilloscope.
-Notice that K_vco can go negative too. In this case we can see if the sign of the gain is an obstacle in the loop locking.
-Of course you can adjust the buttons and the macros to get different types of variations. I strongly encourage you to do so as an exercise
<excelunusual.com> 5
Implementing the calculation section
-The formulas will be calculated in the order shown by the red arrow.
This is inspired by the shape of the signal path.
-It is very important to avoid circular a reference, which means a series of formulas where the last formula references the first hence resulting in a closedcalculation loop.
-We need therefore to use the signal “u-out(n-1)” which is fed into phase detector as taken from the previous time step in order to avoid a circular reference.
Where do the first and fifth formulas come from? By the definition, the frequency is:
During the short time step of course the above linear approximation holds true. By further developing the relationship we get:
The VCO frequency will deviate from its free oscillation value by an amount equal to:
to be continued…
by George Lungu <excelunusual.com> 6