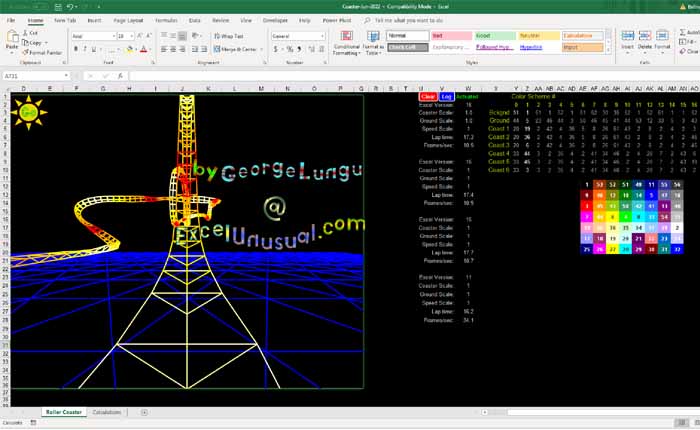
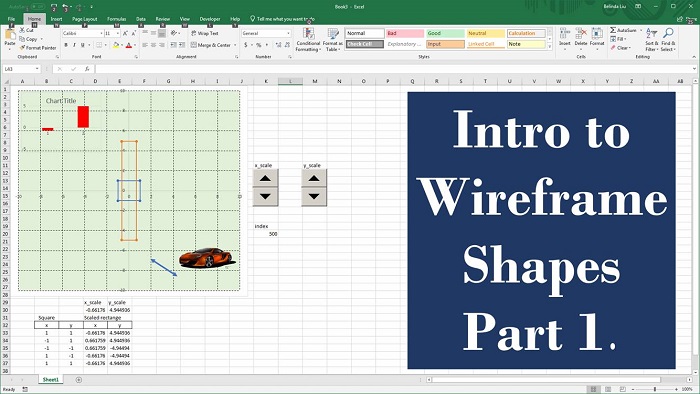
Using autoshape freeforms is a very easy way to duplicate object outlines from pictures.
It is convenient to create a freeform and once created, its vertices (points) can be edited with without difficulty.
Aditional points can be inserted and others can be deleted. This is a tutorial about a series of macros which allow the extraction of freeform vertex coordiantes to a worksheet range in Excel.
These coordinates can be later employed to create 3D wireframe objects for various models.
VertX a Very Useful Macro for Extracting Vertex Coordinates of Freeforms – part #1
by George Lungu
– Freeforms are easy to work with and are very suitable to copying object contours from pictures.
– This presentation introduces a macro which can retrieve the x-y coordinates of a freeform autoshape
group and place the data on two columns with an empty space between data for two consecutive shapes.
– This way all the group of shapes can be charted using a single curve on a 2D scatter chart.
– Another function of this macro is to plot each shape name, number of vertices and the number of
shapes in the group.
– The macro will be explained here in a simplified form and its complexity will be increased as we
advance through the sections of the presentation.
Extracting the number of points (vertices) of a freeform:
-There are various ways to identify the shape (by name for instance is
one) but it can be chosen to be identified by selection
– We will assign the variable NC the node count using the following
construct (I found this in a slightly different form on Microsoft’s site):
NC = ActiveWindow.Selection.ShapeRange.Nodes.Count
-An alternative way would be to use a name identification of the shape:
NC = ActiveSheet.Shapes(“Name”).Nodes.Count
<excelunusual.com>
-If we use the name identification we need to know the name of the
shape which can be found by selecting the shape and reading the
name in the “Name Box” in the upper left corner of the worksheet.
– We can also change the name to something else by typing it in the
same box and then hitting Enter.
Extracting the vertex coordinate array of a freeform:
-We will identify the shape either by name or by selection and retrieve the vertex data as an array
(this is standard syntax so you should just use it and if you forget just Google it):
VertArray = ActiveSheet.Shapes(“Name”).Vertices
VertArray = ActiveWindow.Selection.ShapeRange.Vertices
– Just like before, if you use the name identification you can find it by reading it in the name box
after selecting the shape.
How do we the find individual coordinates from the array of coordinates:
-The vertex coordinate array is of n x 2 size so we will use the following syntax:
Variable_x = VertArray(n, 1) assigns the variable “Variable_x” the x-coordinate of the nth vertex of the shape
Variable_y = VertArray(n, 2) assigns the variable “Variable_y” the y-coordinate of the nth vertex of the shape
<excelunusual.com>
2
An absolute coordinate vertex-retrieving macro:
– Here is a macro that retrieves the node (vertex)
Sub VertX_1()
count and assigns it to variable “NC”. It also
NC = ActiveSheet.Shapes(“a”).Nodes.Count
assigns the variable VertArray with the values of
VertArray = ActiveSheet.Shapes(“a”).Vertices
shape vertices. After this it prints all this data in
ActiveCell.Offset(0, 0).Value = NC
a spreadsheet range. The name of the shape has
For n = 1 To NC
to be “a” for this macro to work.
ActiveCell.Offset(n – 1, 1).Value = VertArray(n, 1)
– The active cell is the selected cell and the macro
ActiveCell.Offset(n – 1, 2).Value = VertArray(n, 2)
will place an integer there equal to the number of
Next n
vertices after which it will place the coordinates in
End Sub
a 2-column table starting from the active row (the row containing the active cell) and going down.
– During the first iteration, the “For” loop pastes the first x-coordinate on the same row, a column to
the right from the active cell and also inserts first the y-coordinate on the active row, two columns to
the right from the active cell.
– In the next iteration, the loop inserts the x and y coordinates one row down from the active cell (on
the same columns as the first x-y coordinates) and the loop continues its operation until a 2 x NC table
is filled with all of the x-y coordinates of the shape vertices.
The use of the macro:
– In a new workbook named “VertX” insert a module in the VBA editor and in it paste the code above.
– Make the drawing toolbar visible: (on the top menu) View => Toolbar => Drawing
– In the drawing toolbar: Autoshapes => Line => Freeform and draw a freeform by clicking in several
points on the worksheet.
<excelunusual.com>
3
– I made a closed 8-point free form but you can create
something different.
– Select the freeform and in the Name Box on the upper left
corner type the letter “a” then hit return. The name of the
shape has just been changed from “Freeform 1” into “a”.
– Select cell “E1” then bring up the VBA editor (Alt+F11)
– In the VBA editor after you make sure your mouse cursor is
placed anywhere within the text of the macro “VertX_1”, hit
the “Run Sub/User Form” triangular button.
– You will get the number of vertices in cell E1 and a list of
the vertex coordinates in range F1:G8.
Chart the freeform coordinates:
– Use a 2D scatter chart with equal size axes.
Important observations:
– Notice that the shape is right-left correct but upside down
since the origin is placed in the upper left corner of the sheet.
– You can see that even if you close the shape, the first point
is not recorded twice in the table, therefore if you want to
have a closed charted curve you need to either paste the first
point coordinates at the end of the table by hand or upgrade
the macro to do that.
– Try rotating the shape and notice that the coordinates
retrieved by the macro will not change unless you edit one
point by dragging it. Linear shifts in the shape position will
however result in new coordinates.
to be continued…
<excelunusual.com>
4


Peter,
Interesting thoughts. Unfortunately I am on the run these days and I picked up the subject in order to build my 3D RC controlled airplane for one of the next topics. It took me a whole evening to find how to do the vertex retrieval. I offer this “as is”. Bezier curves are not in my colimator yet. In 2003 the regular 2D scatter charting of few hundred of vertices is lighting fast and I found out that the curves look reasonably good with or without smoothing on (soon I will post a Lisa Simpson example). In 2007 the charts are better looking (including the plot lines) but the program is slow. I hope to post a 3D canoe by tonight. George
George
It is interesting that you have chosen to start the tutorials on shape with the very versatile but somewhat complex freeform shape. Life gets still more interesting when some of the vertices are used as intermediate control points to give Bezier curves. It is hard for a scatter chart to render such shapes (how to generate points on a single Bezier curve could be the subject of a complete posting).
Converting the freeform to a scatter chart illustrates the basic points well but that begs the question of whether it is better to exploit the freeform to convey information to the user. I started developing an Excel workbook to act as a front end to a panel buckling program. Ultimately I abandoned the scatter charts which I originally used to sketch the cross-section of a stringer-stiffened panel in favor of using the freeform shapes directly.
What I do not have any feel for though is the relative speed at which Excel renders charts and the equivalent shape objects.