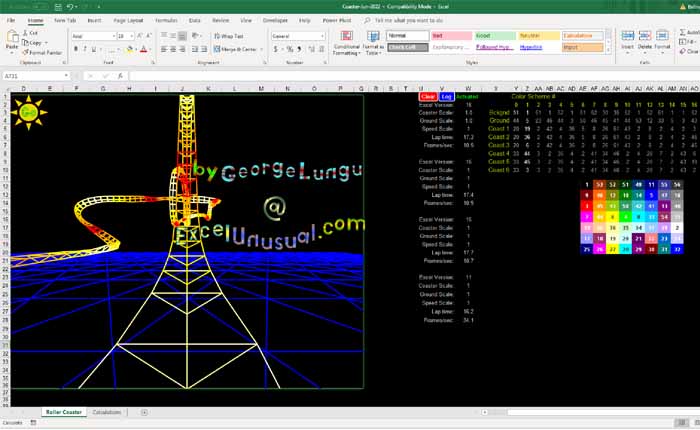
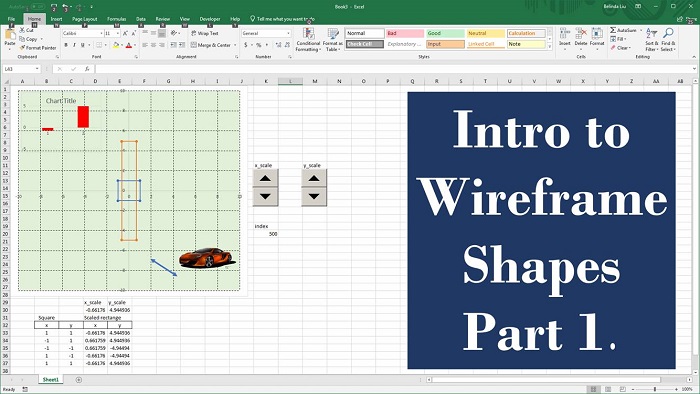
The first macro created in this section of the tutorial improves on the previously developed macro by correcting the up-down orientation of the shape, referencing the shape position to the coordinate of the first drawn point and closing the shape by repeating the coordinates of the first point at the end of the table.
A last macro is then created which can retrieve multiple shape vertex coordinates, placing them in a table together with the number of points contained in each shape and the name of each shape.
VertX a Very Useful Macro for Extracting Vertex Coordinates of Freeforms – part #2
by George Lungu
– While the last section introduced a basic macro for retrieving the coordinates of a freeform autoshape
the current section proceeds to addressing some of the shortcomings of that macro.
– Two macros will be presented here. The first one reverses the y coordinate, introduces an extra data
point in the table to close the shape and also references the all the coordinates of the shape to the first
coordinate. The second macro will extract vertex coordinates for a group of Freeforms and place them in
a table with blank spaces between them.
An improved version of the macro:
– Comparing this macro to the first
Sub VertX_2()
one (in the last section of the tutorial),
NC = ActiveWindow.Selection.ShapeRange.Nodes.Count
please notice the change in sign of the
VertArray = ActiveWindow.Selection.ShapeRange.Vertices
y-coordinate and the fact that all the
ActiveCell.Offset(0, 0).Value = NC
other coordinates are referenced to the
For n = 1 To NC
first vertex coordinates.
ActiveCell.Offset(n – 1, 1).Value = VertArray(n, 1) – VertArray(1, 1)
– The last two new lines just before the
ActiveCell.Offset(n – 1, 2).Value = -VertArray(n, 2) + VertArray(1, 2)
end of the macro have the function of
Next n
creating an extra point of data
ActiveCell.Offset(NC, 1).Value = VertArray(1, 1) – VertArray(1, 1)
identical to the first one in the table.
ActiveCell.Offset(NC, 2).Value = -VertArray(1, 2) + VertArray(1, 2)
This is necessary only when we need to
End Sub
generate a closed shape.
Macro usage:
– In this new version of the macro we used a method of shape identification
by selection so we need to be careful, since the vertex coordinate extraction
procedure has changed from the previous macro.
– In order to use the macro we need to first select a cell, after which we
need to select the shape we would like to characterize and then click on the
“Run” button in the VBA editor window.
– The selected cell (where we need the table to start) will apparently
unselect itself when we select the shape but you should not worry since the
active cell will remain the same.
– A 7-vertex freeform was drawn. Cell B17 was chosen as the active cell
and before shape selection and it will store the number of vertices.
Charting the shape – a few observations:
– I created a 7-point autoshape freeform but as you can see in
the extracted table above, the x-y coordinate table spans over
8 rows with the first and the last coordinates being the same.
– The plot of the extracted coordinate data now looks fine,
being a closed shape, having the correct orientation and being
referenced to the firstly drawn vertex.
– Depending if you have close or open shapes you might need to alter the vertex coordinate extraction macro.
<excelunusual.com>
2
VertX_3 – a macro for extracting vertex coordinate data for multiple open shapes:
– This macro will run on a group of selected open shapes. For each shape will print the number of
vertices, the name of the shape and the total number of selected shapes in the first column (A1 in this
case) and the vertex data in the next 2 columns with two blank rows separation between shape data.
variable declarations, “i” is the current shape number, “n” is the current vertex
Dim i, n, r, NC As Integer
number, “r” is the current length of the data table (including blanks between
Dim x0, y0 As Double individual shape data), (x0,y0) are the first vertex coordinates of the first shape,
Dim CL As Range and CL is the range of the cell where the data table starts (you can adjust that
from A1 to something else).
————————————
macro declaration
Sub VertX_3()
resets the number of coordinates and blank lines between consecutive shape data
r = 0
prepares the data range by clearing off all previous information
[A1:C5000].Clear
sets the active range to call “A1” – you can modify that to something else
Set CL = [A1]
starts a slow loop running through the series of shapes
For i = 1 To ActiveWindow.Selection.ShapeRange.Count
assigns variable NC the number of nodes for
NC = ActiveWindow.Selection.ShapeRange.Item(i).Nodes.Count
the current shape
VertArray = ActiveWindow.Selection.ShapeRange.Item(i).Vertices assigns VertArray the vertex data for the
If i = 1 Then x0 = VertArray(1, 1) current shape
If i = 1 Then y0 = VertArray(1, 2) assigns the coordinates of the first vertex of the first shape to x0,y0.
CL.Offset(r, 0).Value = NC assigns the vertex count of the current shape to a cell
CL.Offset(r + 1, 0) = Selection.ShapeRange.Item(i).Name assigns the name of the current shape to a cell
CL.Offset(r + 2, 0) = ActiveWindow.Selection.ShapeRange.Count assigns the number of shapes to another cell
For n = 1 To NC starts a fast loop running through the series of vertices of the current shape
CL.Offset(r + n – 1, 1).Value = VertArray(n, 1) – x0 sequentially assigns the relative x and y coordinates
of each vertex of the current shape to the data table
CL.Offset(r + n – 1, 2).Value = -VertArray(n, 2) + y0
Next n end of the fast loop declaration
increments the row position index so that the next shape data is
r = r + NC + 2
inserted under the current data leaving two blank spaces.
Next i
end of the slow loop declaration
End Sub
<excelunusual.com> end of macro declaration
3
Macro usage:
– I copied the Lisa Simpson’s head from the drawing workbook and pasted it in the sheet
“Tutorial_2_multiple_shapes”
– I also created a green “Evaluate” button and assigned the VertX_3 macro to it.
– Click the “Select Objects” icon from the drawing menu and your cross cursor will turn into an arrow.
– Drag-select all shapes from Lisa’s head and then click the “Select Objects” again to get back to the
white cross cursor. After this click the
green “Evaluate” button being careful
that Lisa stays selected and the macro
will create the data table for you.
Charting the shape:
– I charted the range B1:C294 on a 2D
scatter chart. You can try removing the
markers and thickening the line as well as
experimenting with smooth or broken
lines.
– Why I chose Lisa? Although she is not
very funny but she is definitely my
favorite character of the series.
– The next tutorial will explain how to
build a 3D canoe using the last macro we
developed. Why a canoe? Its panels are
simple to draw and it would make a very
nice looking 3D model.
The End.
<excelunusual.com>
4


