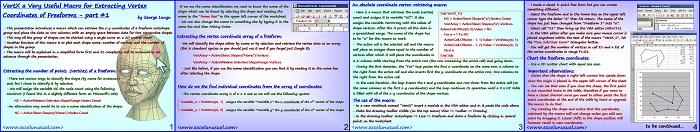
Using autoshape freeforms is a very easy way to duplicate object outlines from pictures. It is convenient to create a freeform and once created, its vertices (points) can be edited with without difficulty. Aditional points can be inserted and others can be deleted. This is a tutorial about a series of macros which allow the extraction of freeform vertex coordiantes to a worksheet… Read More... "VertX – a Very Useful Macro for Extracting the Vertex Coordinates of Freeforms – part #1"
Excel Drawing – creating graphical object data
This tutorial will introduce the reader to creating simple drawings in Excel by using the “Freeform” auto shape. Later on, we will be able to convert this data in x-y-z vertex information for various models by using a macro. [sociallocker][/sociallocker] Drawing in Excel – part #1 – an introduction tocreating freeform type autoshapes – On this blog we will soon need to… Read More... "Excel Drawing – creating graphical object data"
Anaglyph Charts Demo #2- an animated heat transfer model using a red-cyan wireframe chart
This is another basic demo investigating the feasibility of using anaglyph wireframes to plot scientiffic data. Open the attached worksheet and with your 3D glasses on, watch the chart. The data is a dynamic temperature map obtained from a 2D heat transfer model in a metal plate. The heat model is complete and you can run it with various parameters. You can… Read More... "Anaglyph Charts Demo #2- an animated heat transfer model using a red-cyan wireframe chart"
Anaglyph Charts Demo #1- creating 3D effects on charts using red-cyan elementary chips (sprites)
This is a basic demo investigating the feasibility of using anaglyph sprites to plot scientiffic data. Open the attached worksheet and with your 3D glasses on, watch the chart. The data results are various temperature maps obtained from a 2D heat transfer model in a metal plate. You have 4 different selectable mapps there but you can also invert the pattern using the “Flip” button. I… Read More... "Anaglyph Charts Demo #1- creating 3D effects on charts using red-cyan elementary chips (sprites)"
Introduction to Anaglyph Stereoscopy in Excel – part #5: adding a joystick to control the yaw and pitch rates of the 3D cube
In this section, a joystick is added to the model which controlls the yaw rate and the pitch rate (not the angles!) of the stereoscopic cube. This joystick was used before in a dedicated tutorial and in the flight simulator tutorial. Its importance in future models can not be underestimated, hence I decided to cover this virtual device again. Use your 3D glasses while… Read More... "Introduction to Anaglyph Stereoscopy in Excel – part #5: adding a joystick to control the yaw and pitch rates of the 3D cube"
Cosmos Naive – a very basic demo of anaglyph stereoscopy with sprites in Excel
Reach out for your 3D goggles because this is a representation of the Cosmos through the eyes of a 5-year old. The model displays a few objects at various depths and move two of them back and forth on a chart to demonstrate the stereoscopic effect. Though very simplistic it is an excellent example of anaglyph stereoscopy in action showing you… Read More... "Cosmos Naive – a very basic demo of anaglyph stereoscopy with sprites in Excel"
Introduction to Anaglyph Stereoscopy in Excel – part #4: worksheet implementation of a stereoscopic cube
This is the final part of the anaglyph stereoscopy tutorial. This part deals with the prectical implementation of the concepts and formulas discussed before to create a 3D cube. You need 3D glasses to notice the stereoscopic effect. The PDF erroneously claims this is part #3 of the tutorial, whereas this is actually part #4 (it’s a typo in the… Read More... "Introduction to Anaglyph Stereoscopy in Excel – part #4: worksheet implementation of a stereoscopic cube"
Introduction to Anaglyph Stereoscopy in Excel – part #3: a few analogies and the derivation of the stereoscopic 3D-2D perspective conversion formulas
This section of the tutorial gives few more real life applications of the stereoscopic vision and also derives the stereoscopic 3D-2D perspective conversion formulas. These formulas are based on the approximation that the that both right and left eyes observe the same v-coordinate. Excel anaglyph stereoscopy #3 – 3D-2D perspective conversion formulas by George Lungu – While the previous section introduced the… Read More... "Introduction to Anaglyph Stereoscopy in Excel – part #3: a few analogies and the derivation of the stereoscopic 3D-2D perspective conversion formulas"
Introduction to Anaglyph Stereoscopy in Excel – part #2: the principles of creating and viewing 3D pictures
This tutorial explains the basic principles of creating and displaying anaglyph pictures. Excel anaglyph stereoscopy #2 – how to split the image by George Lungu – The previous section showed an improvement in the practical implementation of spreadsheet multiplication, namely based on the associativity of matrix multiplication the three elementary rotation matrices were combined in a composite rotation matrix which… Read More... "Introduction to Anaglyph Stereoscopy in Excel – part #2: the principles of creating and viewing 3D pictures"
A 2D Demo for Spherical Mirrors in Excel – with virtual reflected rays
This is a demonstrative model for 2D spherical mirror ray tracing in Excel displaying both the real reflected rays and the virtual reflected rays. You you have the option of turning the visibility of the virtual rays off if you wish. It works in Excel 2003 at about 40 frames per second and in Excel 2007 at about 4 frames per second.… Read More... "A 2D Demo for Spherical Mirrors in Excel – with virtual reflected rays"
Introduction to Anaglyph Stereoscopy in Excel – part #1: a more efficient composite rotation in the 3D Cartesian space
I made a stereoscopic model in October last year, however, choosing the wrong colors (red and blue on a black background, the effect was very weak (if any). This series was suggested to me last week by one of the guests here on the website, Don L. (thanks Don!), who sent me his stereoscopic cube. I opened the model, put on… Read More... "Introduction to Anaglyph Stereoscopy in Excel – part #1: a more efficient composite rotation in the 3D Cartesian space"
Introduction to Geometrical Optics – a 2D ray tracing Excel model for spherical mirrors – Part 7
Based on the formulas derived up to this point in the series, this section creates an improved custom VBA function which calculates the x-y Cartesian coordinates of three points: the incident point, the terminal point of the real reflected ray and the terminal point of the virtual reflected ray. The structure of the function is fairly simple and it is… Read More... "Introduction to Geometrical Optics – a 2D ray tracing Excel model for spherical mirrors – Part 7"
Introduction to Geometrical Optics – a 2D ray tracing Excel model for spherical mirrors – Part 6
This section simplifies the formula for the Cartesian coordinates of the terminal point of the reflected ray and derives a very similar formula for a terminal point of the virtual reflected ray. In the next section all these new formulas together with some old formulas will be combined into a new user defined VBA function which will be used alone… Read More... "Introduction to Geometrical Optics – a 2D ray tracing Excel model for spherical mirrors – Part 6"
Introduction to Geometrical Optics – a 2D ray tracing Excel model for spherical mirrors – Part 5
This brief section takes the two previously created custom VBA functions (Reflect() and Chart_Reflect()) and use them to create the data for both the incident and the reflected bundles of rays within the same table. The data is then plotted on the same chart with the mirror and the result is a preliminary model which you can experiment with. [sociallocker][/sociallocker]… Read More... "Introduction to Geometrical Optics – a 2D ray tracing Excel model for spherical mirrors – Part 5"